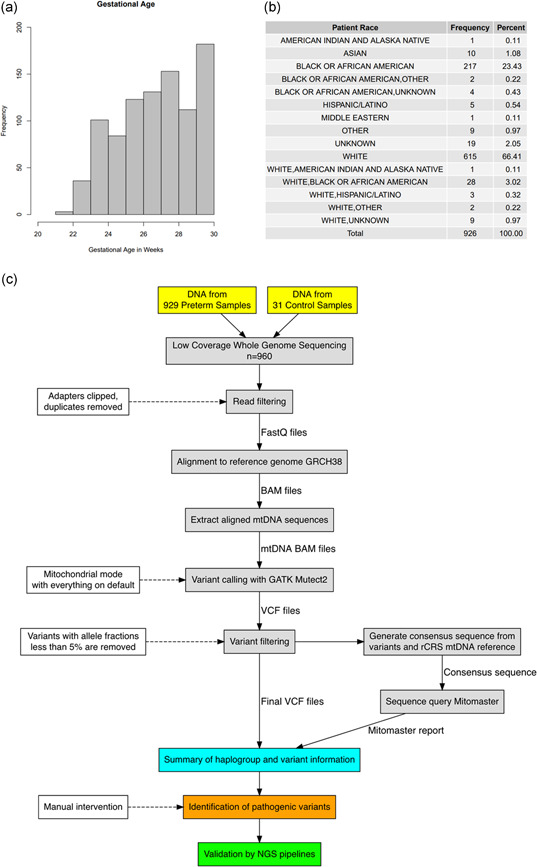
Figure 1.

Summary of the preterm patient cohort and low‐coverage whole‐genome sequencing (lcWGS) analysis pipeline. (a) Histogram of gestational age in the 926 preterm samples, not including the three discarded samples and 31 technical controls. (b) Summary of racial demographics for the 926 preterm samples. (c) Flowchart for Mutect2 pipeline and visual summary of the lcWGS data analysis. The solid lines represent the flow of information while the dashed lines indicate the criteria and settings for the data filtration steps. Manual inspection was required for the identification of pathogenic variants (see Section 2)
