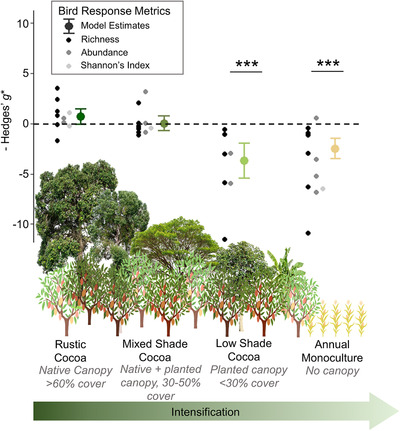
FIGURE 2.

Mean effect size differences in three bird biodiversity metrics between forest and four farming systems of increasing intensity (>0, greater biodiversity in the farm than forest; <0, less biodiversity in the farm than forest; ***, model estimate of Hedges’ g* significantly different from 0 at p< 0.001; model estimate tails, 95% CIs). Data compiled from 16 studies of biodiversity in cocoa.
