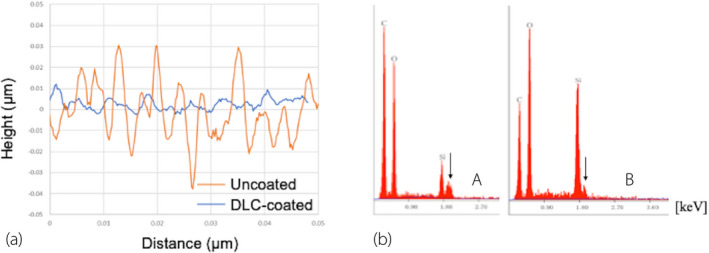
Fig. 4.

Physicochemical analysis. (a) Roughness (Ra) results measured using a New View 5320. The DLC‐coated surface exhibited a 70% decrease in mean Ra value relative to the uncoated silicon surface. (b) Proportions of elements on the silicon surface. Proportions of surface elements as determined by the EDX method and corrected by the ZAF method using a HITACHI S‐4800. The proportion of carbon increased on the DLC‐coated surface (A) relative to the uncoated surface (B). The arrow indicates the osmium peak. C: carbon, O: oxygen, Si: silicon.
