
Fig. 8.
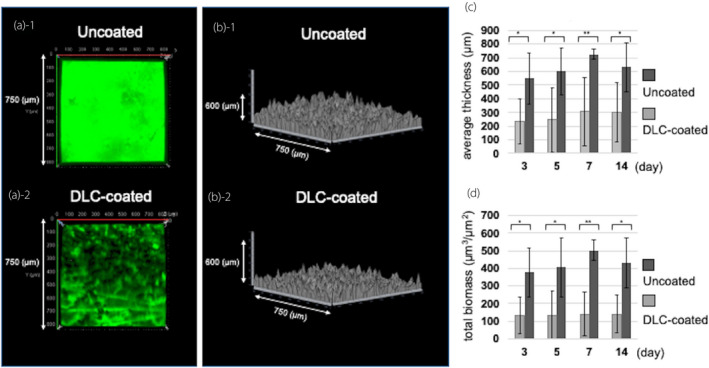
Analysis of biofilm formation by P. aeruginosa OP14‐210 (pMF230). (a, b) Images visualized with a Zeiss LSM780 and reconstructed using LSM ZEN‐software on day 3. All images were taken on a 750 μm × 750 μm square section. (a) Three‐dimensional image. (a‐1) Uncoated. (a‐2) DLC‐coated. (b) 2.5‐dimensional image. (b‐1) Uncoated. (b‐2) DLC‐coated. (c, d) Comparison of the biofilm quantified by reconstructed CLSM images using the COMSTAT software. (c) Average thickness. (d) Total biomass. Values represent the mean ± SD of nine image stacks acquired in three independent experiments. P values were obtained using a paired t‐test. *P < 0.05, **P < 0.001.