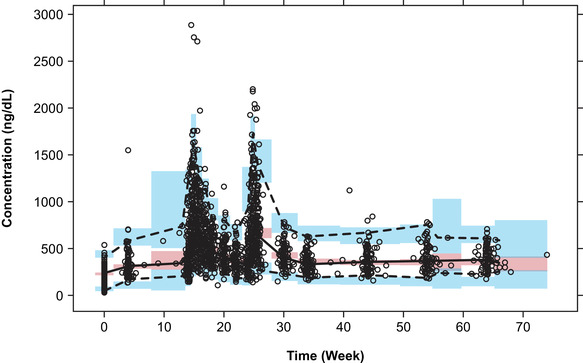
Figure 2.

Prediction‐corrected visual predictive check for total testosterone conducting 1000 simulations with the final pharmacokinetic model. Circles, observed individual data; dashed and solid black lines: 2.5th, 50th, and 97.5th percentiles of the observed data; blue and red shaded areas, median and 95% prediction interval of simulated data.
