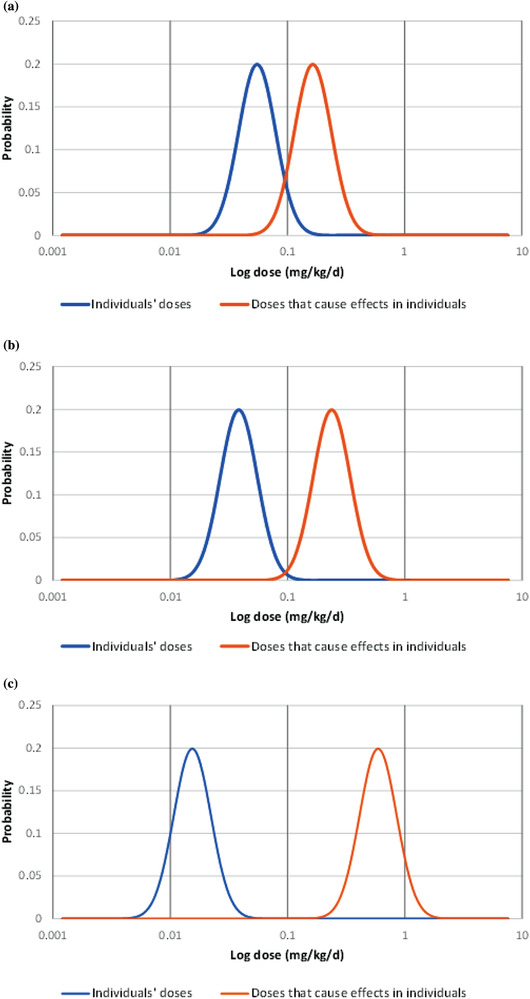
Fig 1.

Risk model based on lognormal distributions (here expressed as probability density functions) of the variability in threshold of doses that cause effects in individuals in the population (toxicity distribution) and variability in doses received by individual members of the population (dose distribution). 1a. Lower bound of toxicity distribution overlaps with the upper bound of the dose distribution and risk is significant. 1b. Distributions slightly overlap, and risk is low. 1c. There is a gap between the upper bound of the exposure and lower bound of the toxicity distributions and risk is zero
