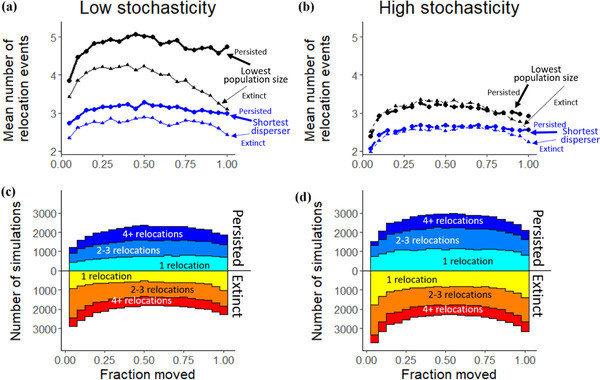
FIGURE 4.

The number of independent relocation events that occurred during assisted migration simulations for low stochasticity and high stochasticity environments: (a and b) mean number of independent relocation events that occurred under a range of values relative to the fraction of the population that was relocated each time (relocated at least once) (black and blue, different target species; thick line, target species persists; thin line, target species went extinct; thermal optimum estimate, realized niche) and (c and d) fate of the species (persistence or extinction) and number of independent relocation events that occurred over the course of the simulation relative to the fraction of the population moved during assisted migration and number of relocations (target species, shortest disperser; thermal optimum estimate, realized niche)
