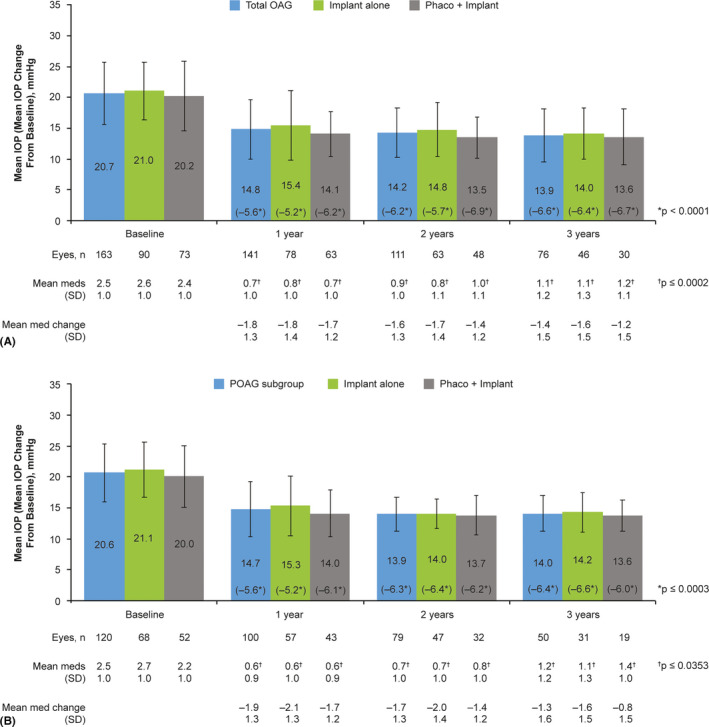
Fig. 1.

Mean and changes in mean IOP and number of IOP‐lowering medications from baseline over time in the total effectiveness.a OAG population with both IOP measurement and number of topical IOP‐lowering medications recorded at baseline (n = 163b) (A) and patient subgroup with POAG (n = 120) (B). Mean IOP data are shown with standard deviations. p values were based on paired t‐tests evaluating the difference in IOP or number of topical IOP‐lowering medications from baseline to the indicated postoperative visit; p < 0.05 was considered statistically significant. aAll effectiveness analyses included one eye per patient; in cases of bilateral implantation, only the first implanted eye was analysed. b11 patients were excluded from analysis of the primary outcome measures as they did not have both IOP and IOP‐lowering medication count data at baseline. IOP = intraocular pressure, meds = medications, phaco = phacoemulsification with intraocular lens replacement, OAG = open‐angle glaucoma, POAG = primary open‐angle glaucoma, SD = standard deviation.
