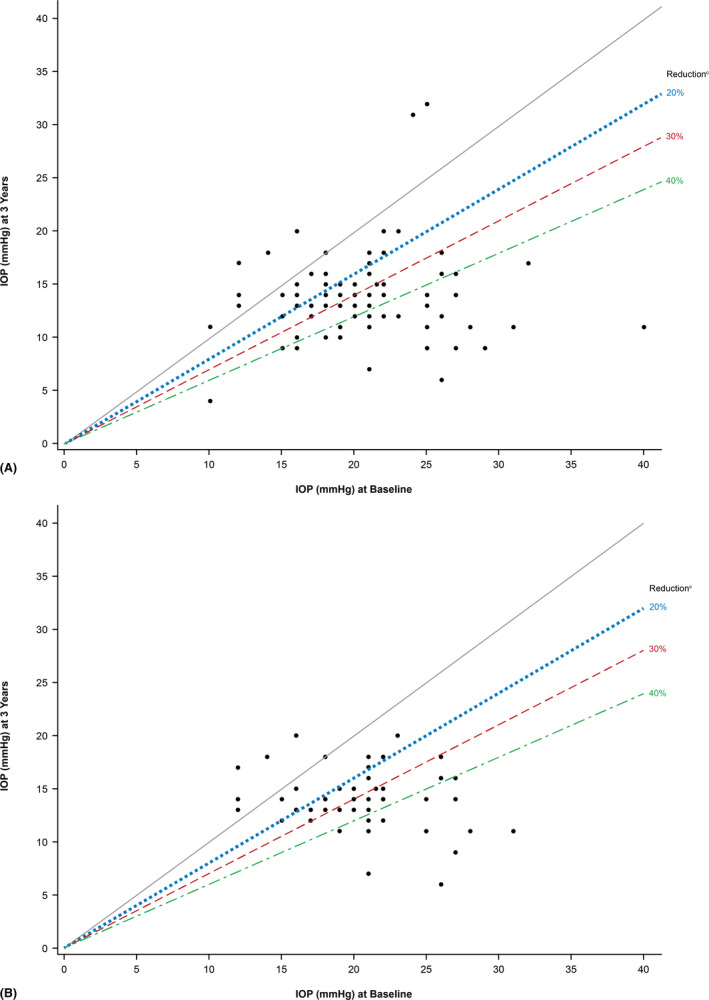
Fig. 3.

Scatter plots of IOP reduction as a function of preoperative IOP at 3 years in the effectivenessa OAG population (n = 174b) (A) and patient subgroup with POAG (n = 123) (B). Each data point represents one eye. The grey line delineates IOP reduction (lower portion) from IOP increase (upper portion), relative to baseline IOP. Data points below the 20%, 30% and 40% IOP reduction lines achieved that level of IOP lowering or more. aAll effectiveness analyses included one eye per patient; in cases of bilateral implantation, only the first implanted eye was analysed. bThis analysis included all patients who had IOP data at baseline. cIndicates IOP reduction success, as defined in the protocol. IOP = intraocular pressure, OAG = open‐angle glaucoma; POAG = primary open‐angle glaucoma.
