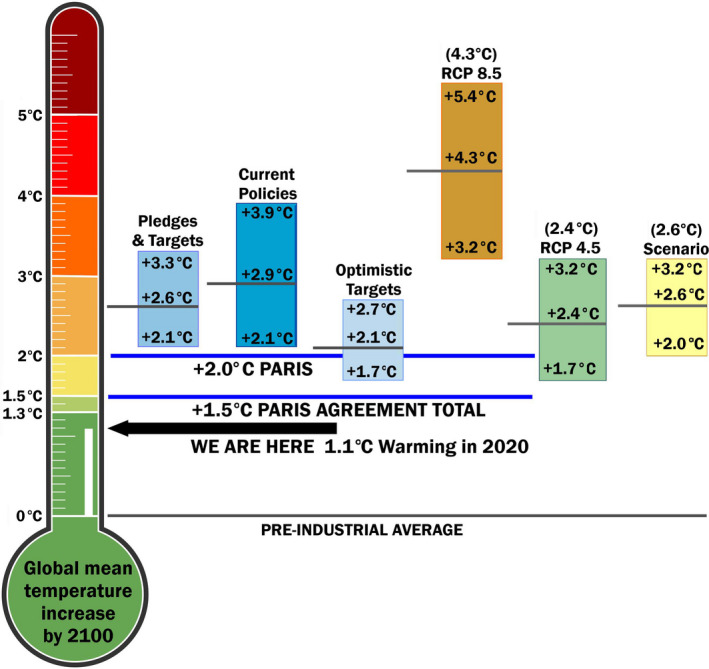
FIGURE 2.

Comparison of climate scenarios with the global mean temperature targets under current policies. The thermometer comes from the Climate Action Tracker (Stockwell et al., 2021), which is an independent scientific analysis to quantify and evaluate climate change mitigation commitments, and assess whether countries are on track for meeting them. For the climate scenarios (orange, green, and yellow boxes), the likely range of global mean temperature values are the global warming increase (°C) projections from the Fifth Assessment Report Table SPM‐2 in: Summary for Policymakers corrected to be relative to pre‐industrial level (Stocker et al., 2013). For RCP scenarios, it is the mean and likely range for 2081–2100, and for the new climate scenario, it is the mean and likely range for 2046–2065. In the text we refer to each scenario by the mean temperature, for example, for RCP4.5 we refer to it as the 2.4°C Scenario. In addition, we used two climate change scenarios meeting the Paris Agreement objectives that produce stable equilibrium global mean temperature at 1.5 and 2.0°C above pre‐industrial levels (horizontal lines, Sanderson et al., 2017). The blue boxes represent the likely range of global median temperature values provided by the Climate Action Tracker analysis in May 2021 to provide the likelihood of temperature goals being met under various policy scenarios. RCP, Representative Concentration Pathway
