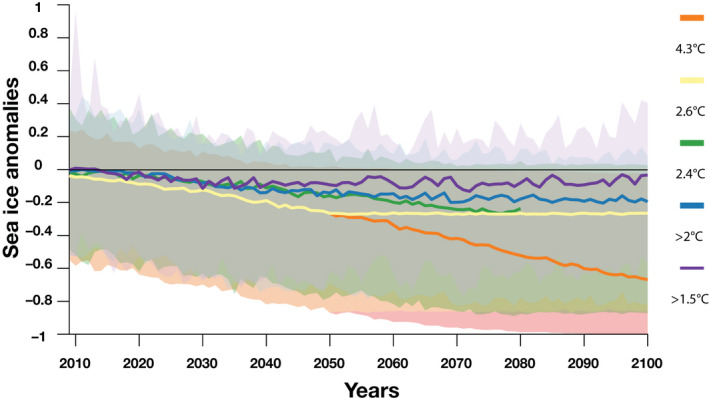
FIGURE 3.

Sea ice concentration anomalies relative to historical level for each climate scenario (colored lines; orange—Scenario 4.3°C [RCP8.5], yellow—Scenario 2.6°C [new scenario], green—Scenario 2.4°C [RCP4.5], blue—Scenario 2.0°C [Paris >2.0°C] and purple—Scenario 1.5°C [Paris 1.5°C]) projected from the Community Earth System Model from 2009 to 2100 (except for Scenario 2.4°C [RCP4.5] as projections are available only to 2080). The median and 90% confidence envelope are calculated across all seasons of the penguin life cycle and across all emperor penguin colonies. The zero black horizontal line is provided to assess the decreasing trend over time. RCP, Representative Concentration Pathway
