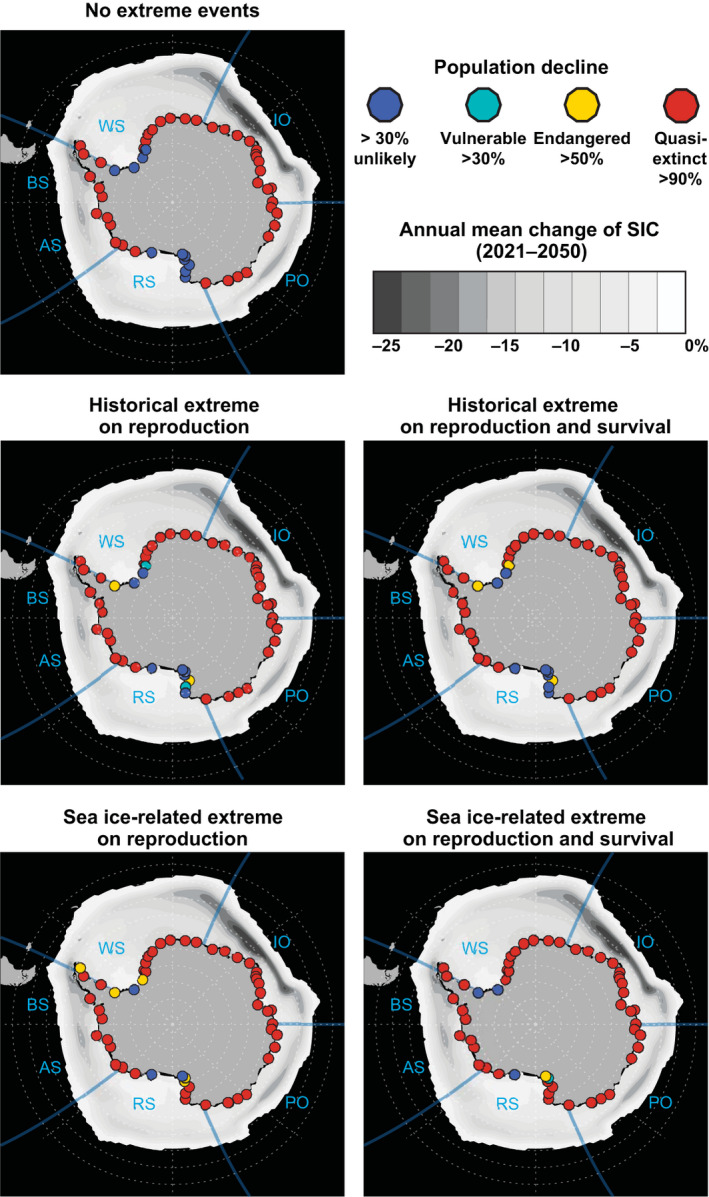
FIGURE 6.

Conservation status of emperor penguin colonies by 2080 and annual mean change of sea ice concentration (SIC) between the 20th and mid‐21st centuries for the 2.6°C Scenario. Panels show each extreme events scenario with all dispersive scenarios combined. SIC projections were obtained from the Community Earth System Model. Dots show the location of colonies (Figure 1; Table S2). Dot colors show the projected International Union for Conservation of Nature Red List conservation status. Following Jenouvrier et al. (2014, 2020), “vulnerable” (green) is a likely population decline by more than 30%; “endangered” (yellow) is a likely population decline by more than 50%; “quasi‐extinct” (red) is a likely population decline by more than 90%. Blue color refers to populations that are not likely to decline by more than 30%. A likely outcome is defined by IPCC as a probability >66%. AS, Amundsen Sea; BS, Bellingshausen Sea; IO, Indian Ocean; RS, Ross Sea; WPO, Western Pacific Ocean; WS, Weddell Sea
