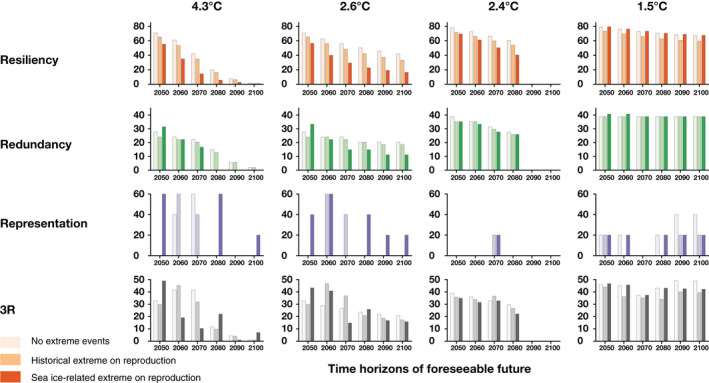
FIGURE 8.

Projected resiliency, redundancy and representation which describe the demography, spatial distribution, and the diversity of ecological settings for emperor penguins, shown at decadal scales between 2050 and 2100 under different greenhouse gas emission scenarios (Scenario 4.3°C [RCP8.5], Scenario 2.6°C [new scenario], Scenario 2.4°C [RCP4.5], Scenario 1.5°C [Paris 1.5°C]). For each time period and each emission scenario, different extreme event scenarios are shown (pale bars—no extreme events, mid‐color bars—extreme events affecting reproduction, and dark bars—sea ice extreme events affecting reproduction). Each R is expressed in percentage and the 3Rs is the arithmetic average of those three percentages. RCP, Representative Concentration Pathway
