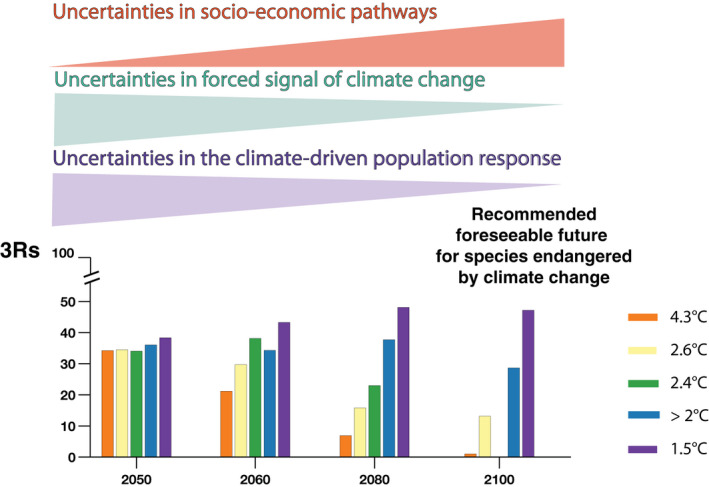
FIGURE 9.

Projected 3Rs (Resiliency, Redundancy, and Representation in %) for emperor penguins at decadal scales between 2050 and 2100 under different greenhouse gas emission scenarios (Scenario 4.3°C [RCP8.5], Scenario 2.6°C [new scenario], Scenario 2.4°C [RCP4.5], Scenario 2.0°C [Paris >2.0°C] and Scenario 1.5°C [Paris 1.5°C]). A graphic depiction is shown (triangles) for the increasing uncertainty over future socio‐economic pathways, and decreasing uncertainties for the directionality of climate change (forcing signals in climate change) and climate‐driven signals in population declines. RCP, Representative Concentration Pathway
