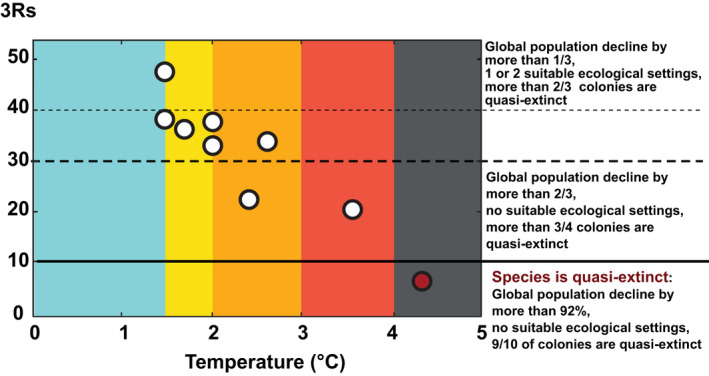
FIGURE 10.

Projected 3Rs at different average global temperature increases. Those average global temperature increases correspond to the global mean temperature values from the Fifth Assessment Report global warming increase (°C) projections corrected to be relative to pre‐industrial level for 2081–2100, and for 2046–2065 (Figure 2). The colors refer to the Climate Action Tracker thermometer from Figure 2. The percentage thresholds (horizontal plain and dotted lines) are arbitrary but illustrate some decline in global population size, numbers of quasi‐extinct colonies and ecological settings (see text)
