FIGURE 1.

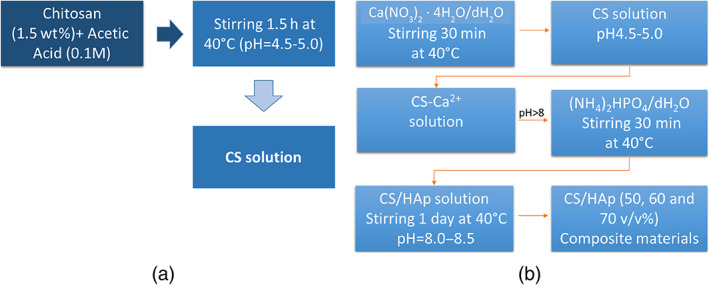
Flow chart representing the preparation of (a) chitosan and (b) CS/HA biocomposite solutions with different content of nHA (50, 60, and 70%v/v)

Flow chart representing the preparation of (a) chitosan and (b) CS/HA biocomposite solutions with different content of nHA (50, 60, and 70%v/v)