FIG. 2.

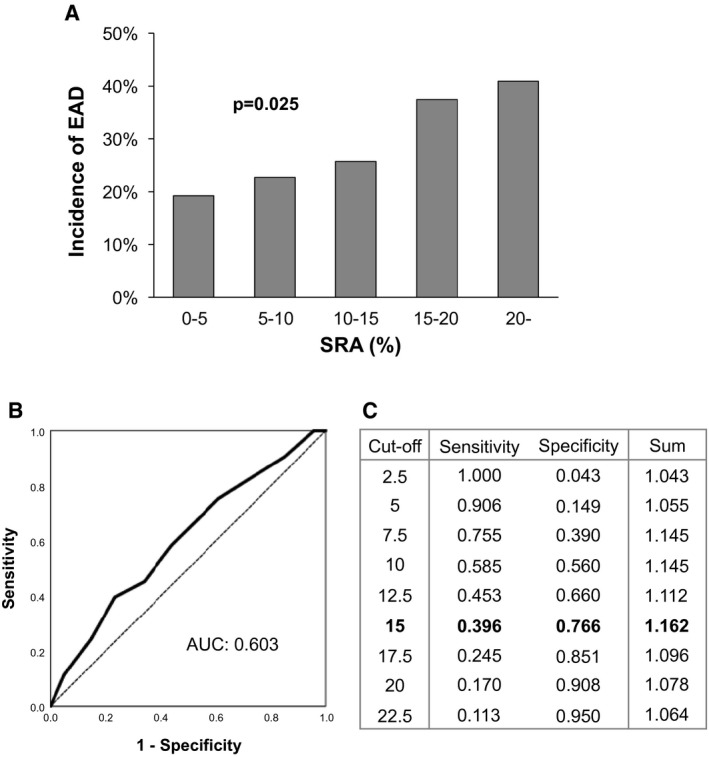
Correlation between SRA and EAD and the determination of the optimal cut‐off value for EAD. The incidence of EAD was positively correlated with SRA (A). Based on the ROC curve (B), the optimal cut‐off value for EAD (SRA = 15%) was obtained according to the maximized sum of sensitivity and specificity (C).
