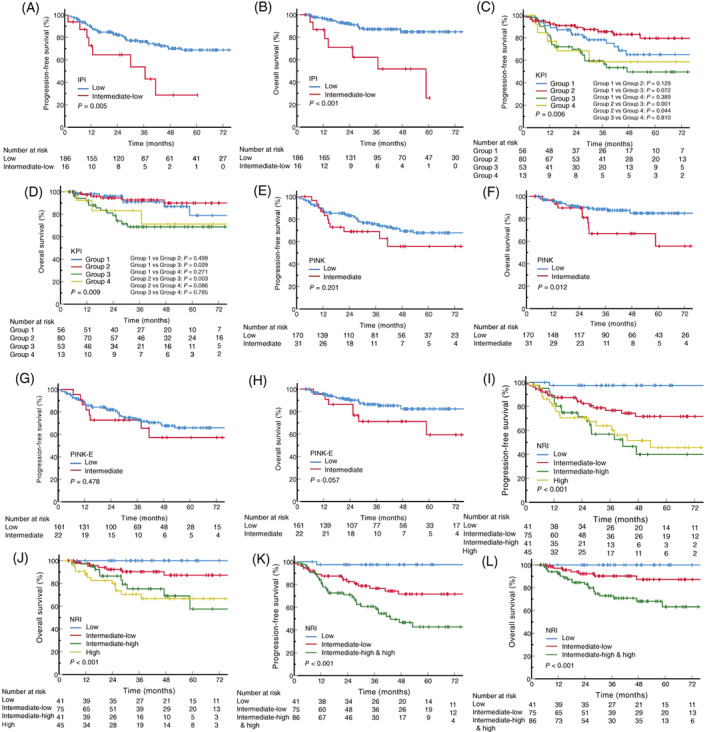
FIGURE 2.

Survival curves stratified by different prognostic models. (A,B) PFS and OS stratified by the IPI model. (C,D) PFS and OS stratified by the KPI model. (E,F) PFS and OS stratified by the PINK model. The one high‐risk patient was excluded from survival analysis. (G,H) PFS and OS stratified by the PINK‐E model. The 184 patients with EBV‐DNA data at initial diagnosis were included, and the one high‐risk patient was excluded from survival analysis. (I,J) PFS and OS stratified by the NRI model. (K,L) PFS and OS stratified by the NRI model after the combination of intermediate‐high‐risk group and high‐risk group. Log‐rank p values are shown. EBV, Epstein–Barr virus; IPI, international prognostic index; KPI, Korean prognostic index; NRI, nomogram‐revised risk index; OS, overall survival; PFS, progression‐free survival; PINK, prognostic index of natural killer lymphoma; PINK‐E, PINK model with circulating EBV‐DNA [Color figure can be viewed at wileyonlinelibrary.com]
