
FIGURE 2.
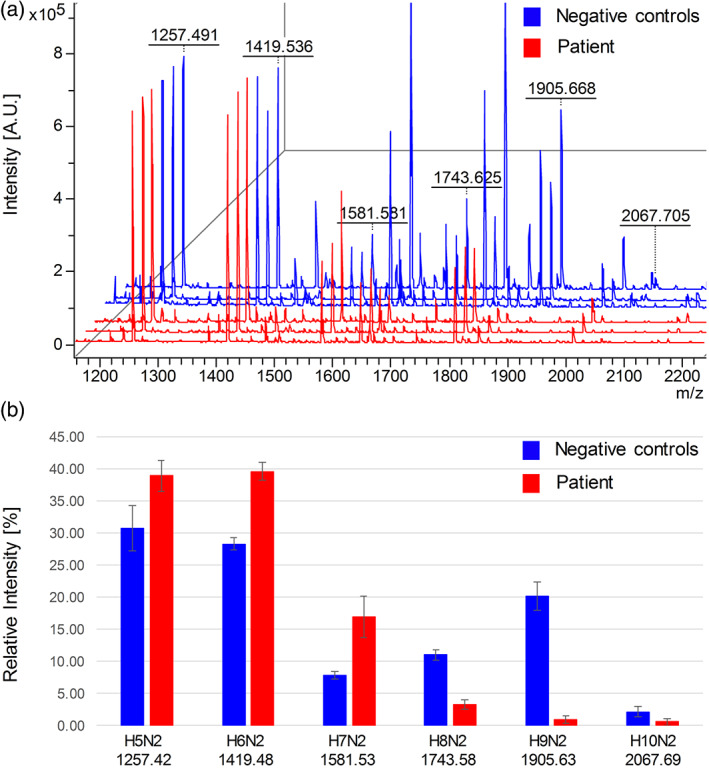
Decreased levels of serum GlcNAc2Man8–9 and GlcNAc2Man9Glc1 indicated ALG12 dysfunction. (a) MALDI TOF analysis of the neutral fraction of free, underivatized N‐glycans released from three technical replicates of patient's serum (red) and three age‐matching negative controls (blue) revealed decreased signals corresponding to GlcNAc2Man8–9 (marked as H8N2 and H9N2) and GlcNAc2Man9Glc1 (marked as H10N2) as well as increased signals corresponding to GlcNAc2Man5–7 (marked as H5N2–H7N2) in the patient's N‐glycome. (b) Average values and standard deviations of relative intensities of indicated high‐mannose N‐glycan structures from (a). Depicted m/z values in (a) and (b) are experimental and theoretical [M + Na]+, respectively