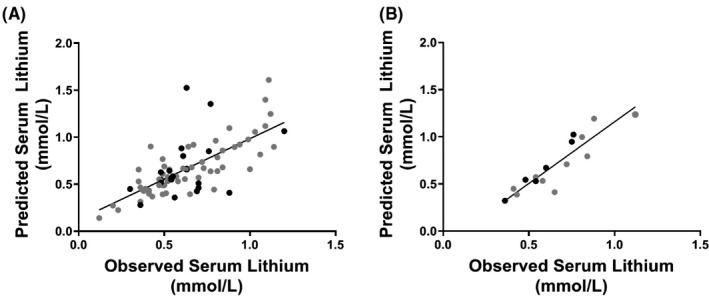
FIGURE 3.

Comparisons of predicted vs. actual lithium levels, based on a single prior within‐subject saliva/serum lithium ratio (A) and an average of three prior within‐subject saliva/serum ratios (B). In panel A, the predicted versus observed serum lithium levels were significantly correlated (Pearson r = 0.71; p < 0.0001), however, this correlation improved dramatically when an average of three ratios were used to predict the 4th appointment (r = 0.90; p < 0.0001). Overall, patients 55 years of age and above showed the most variability in saliva/serum lithium ratio levels (black data points in A, B). Patients were included in Figure 3A if they attended two or more appointments, and Figure 3B if they attended four or more appointments
