
FIGURE 4.
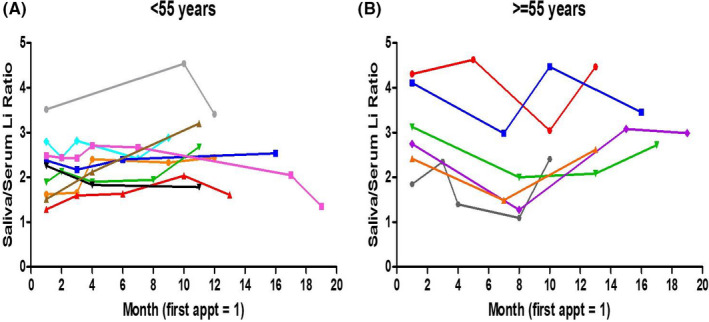
Saliva/serum ratios for individual patients across multiple visits in patients younger than 55 years (A) and equal or greater than 55 years (B). Patients' first study appointment is represented by month 1, followed by every subsequent appointment, spaced by months since the first appointment. For clarity, only data from patients attending visits spanning 10 months or greater from their initial appointment are shown. Each color represents an individual patient. Saliva/serum ratios for all patients attending at least two appointments are shown in Table S1