
FIGURE 2.
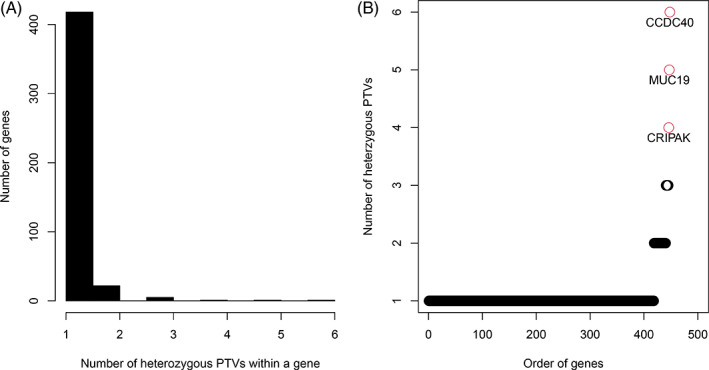
Premature truncating variant (PTV) analysis results illustrated with a histogram for the genes distributed by the number of PTVs they carry (a) and with a scatter plot for genes ordered by the number of hosting PTVs (b). The red colored dots are genes with 4 or more PTVs [Colour figure can be viewed at wileyonlinelibrary.com]