
FIGURE 1.
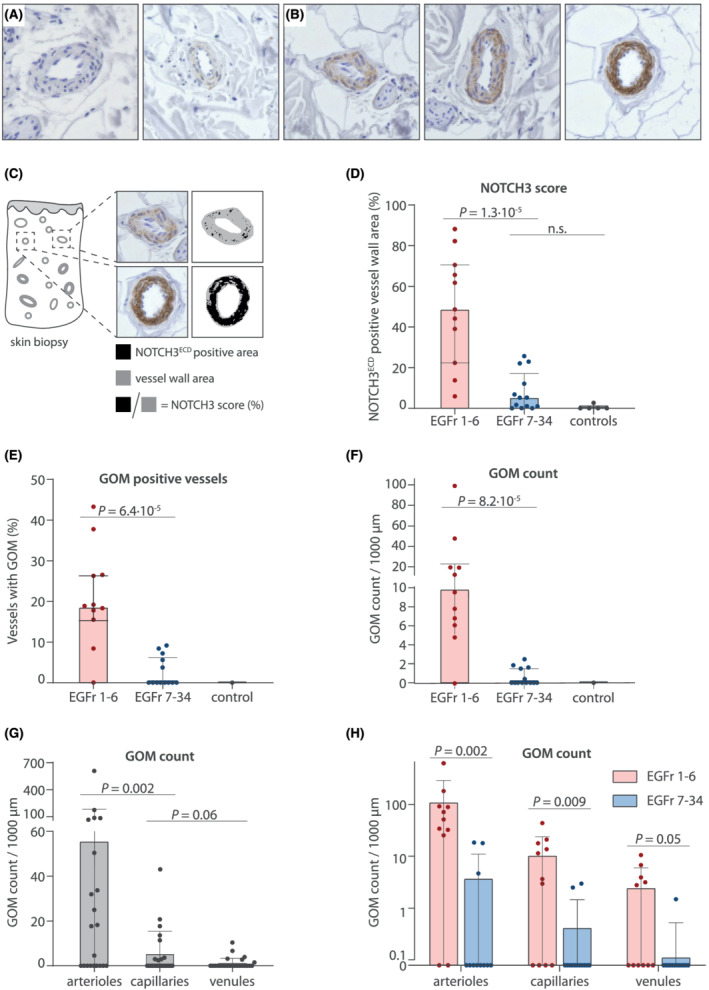
NOTCH3 score and GOM load are significantly lower in CADASIL patients with NOTCH3 cys variants in EGFr 7–34 in skin biopsies. (A,B) representative images of NOTCH3 immunostaining on skin vessels of (A) controls and (B) CADASIL patients. Controls show a negative NOTCH3 staining, whilst CADASIL patients show a positive and granular NOTCH3 staining. (C) NOTCH3 score: The vessel wall area positive for granular NOTCH3ECD staining is expressed as the percentage of the total vessel wall area. (D) Patients with NOTCH3 cys variants located in EGFr 7–34 have lower NOTCH3 scores than patients with EGFr 1–6 variants (median NOTCH3 score 5.2% [IQR 11.1] versus 48.6% [48.2], P = 1.3·10−5). (E,F) patients with NOTCH3 cys variants located in EGFr 7–34 have less GOM‐positive vessels than patients with EGFr 1–6 variants (median 0.0% [IQR 5.6] versus 18.8% [10.9], P = 6.4·10−5) and a lower overall GOM count (median 0.0 GOM/1000 μm [IQR 1.6] versus 9.8 [15.2], P = 8.2·10−5). (G) GOM deposits are more prevalent in arterioles than in capillaries and venules (median 11.2 GOM/1000 μm [IQR 50.6], 0.0 [3.3] and 0.0 [0.7], respectively). (H) The difference in GOM count between the EGFr groups was also observed in arterioles, capillaries and venules separately. To facilitate interpretation, data is plotted on log10‐axis and represent mean ± standard deviation in H. In D‐G, data represent median ± interquartile range. P values are calculated from transformed variables