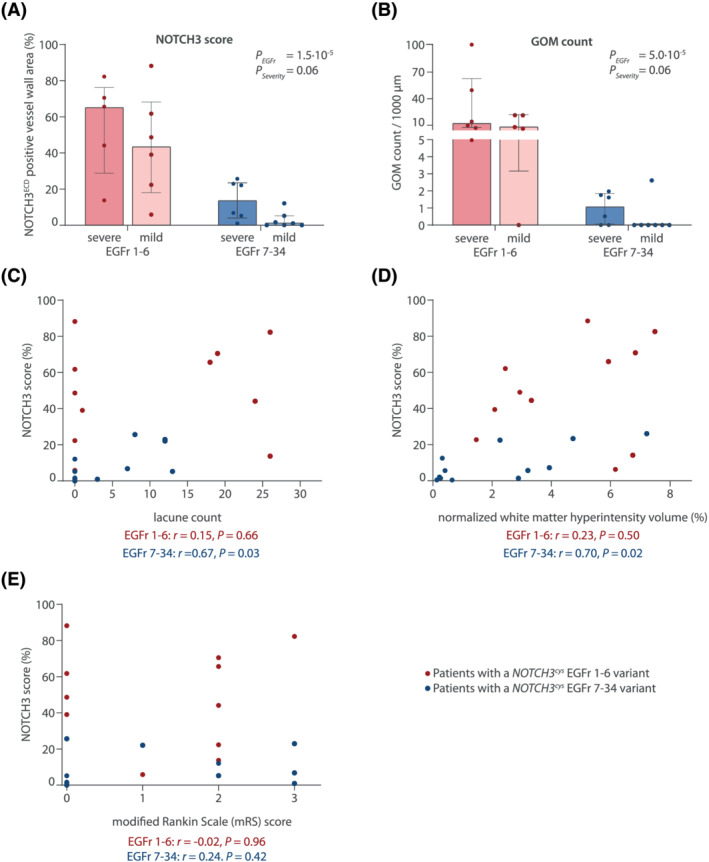
FIGURE 3.

Association between NOTCH3 score, GOM load and disease severity. (A) NOTCH3 score and (B) GOM count were higher in patients with a severe phenotype compared to those with a mild phenotype (P = 0.06 for both NOTCH3 score and GOM after correction for EGFr group). This was mainly attributable to differences between mild and severe patients in the EGFr 7–34 group. Data represent median ± interquartile range. (C,D,E) scatter plot showing the relation between NOTCH3 score and lacune count (C), white matter hyperintensity volume (D) and modified Rankin scale score (E)
