
FIGURE 7.
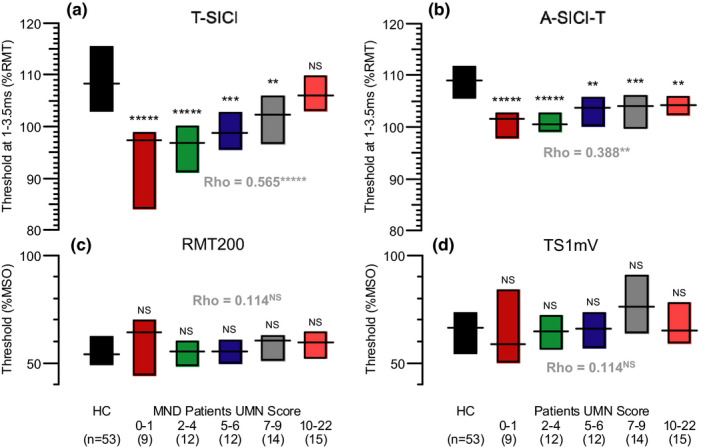
Paradoxical relationship between SICI and UMN score in MND patients. (a) Mean T‐SICI from 1 to 3.5 ms comparing healthy controls with progressive changes in UMN score in subgroups of MND patients, with the most abnormal SICI found in patients with the fewest UMN signs. (b) Corresponding changes in normalized A‐SICI. (c) RMT200 values for the same recordings as in (a), showing no significant differences. (d) TS1 mV values for the recordings in (b). In each plot, horizontal lines are medians and bars indicate interquartile ranges. Asterisks indicate significant differences from healthy controls by Mann–Whitney U test: NS, p > 0.05; **p < 0.01; ***p < 0.001; ****p < 0.0001; *****p < 0.00001. Spearman's rho values also shown for correlations between UMNS and SICI or RMT for all 62 MND patients