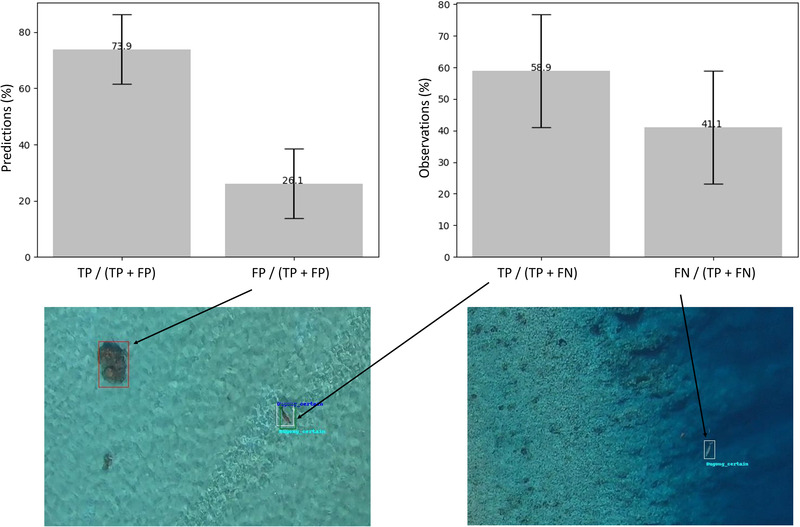
FIGURE 3.

Results of dugong detection for the baseline run (trained with social media images only) applied to test field images: left graph, mean percentage of true positives (TPs) and false positives (FPs) in the predictions; right graph, mean percentage of TPs and FNs (false negatives) in observations (error bars, SD). Images are examples for a TP (green) (predicted bounding box associated with an annotated bounding box [white]), an FP (red) (predicted bounding box not corresponding to an annotated bounding box; here a coral patch), and an FN (annotated bounding box not corresponding to a predicted bounding box)
