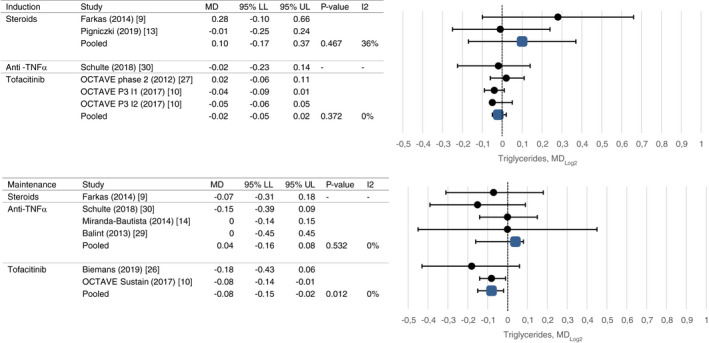
FIGURE 5.

Mean change in triglycerides after induction and maintenance therapy.
Abbreviations: Forest plots visualizing effect sizes of drug classes on lipid profiles, expressed as pooled mean difference on the Log2 scale. LL, lower limit; MD, mean difference; UL, upper limit
