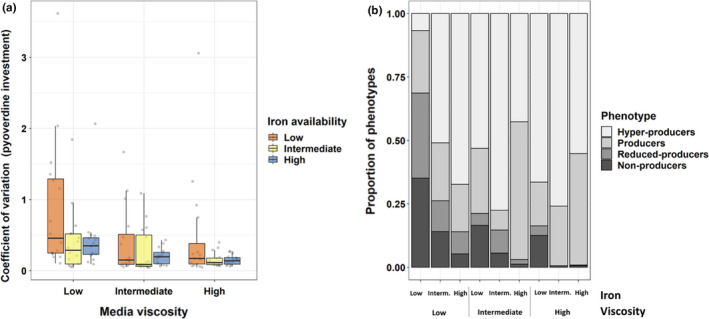
FIGURE 3.

Variation and classification of pyoverdine phenotypes in clones evolved in nine different environments. (a) Coefficient of variation (SD/mean) for pyoverdine production phenotypes across clones from the same population. We measured pyoverdine production via its natural fluorescence and scaled to the optical density (OD600) of the population. Box plots show the median and the 1st and 3rd quartiles across the 16 independently evolved populations (depicted by the individual dots). (b) Distribution of discrete pyoverdine production phenotypes for all nine environments after 100 rounds of experimental evolution. We allocated clones to phenotype categories according to their pyoverdine production levels scaled relative to the ancestor (100%). (1) Nonproducers: less than 10%; (2) reduced‐producers: 10%–70%; (3) producers: 70%–130%; (4) hyperproducers: more than 130% of ancestral production. Fisher's exact test reveals significant differences in category frequencies between any two environments
