
Figure 9.
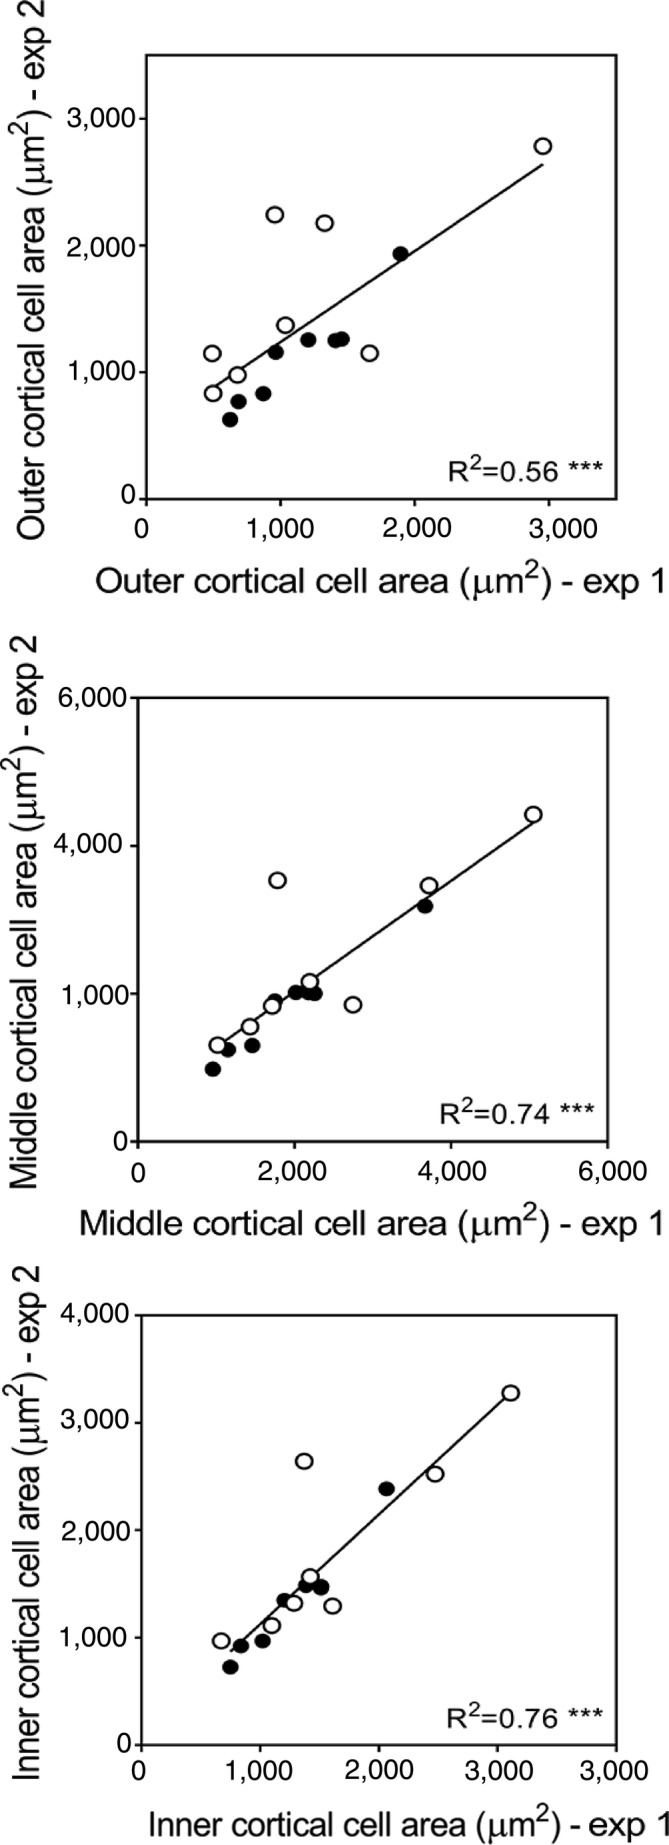
Correlation between cell size from different cortical regions of experiment 1 (column trial in soil) and experiment 2 (grown hydroponically). Each point represents the average cell area of a genotype for paired data of both experiments. Paired data is either ‘before the layer’ with control or ‘within the layer’ with ethylene treatment. Black circles were used for data of node 3 and white circles for data of node 4. *** Level of significance at p ≤ .001