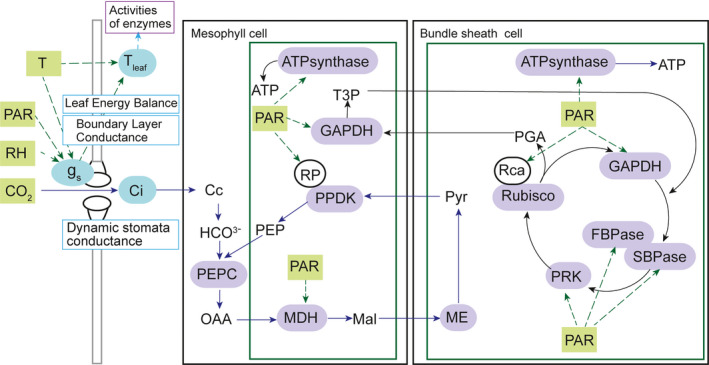
Figure 1.

Metabolic model schematic of C4 photosynthesis. The model includes all metabolites and enzymes of photosynthetic carbon metabolism, as detailed previously (Wang et al., 2014). Here, only enzymes that are light modulated and therefore modified in this new dynamic model are indicated. Green rectangles are driving environmental variables affecting enzyme activities (purple) and stomatal conductance. Blue blocks are state variables calculated from leaf energy balance for T leaf, dynamic stomatal response model for stomatal conductance (gs ), and from the external [CO2], gs and predicted leaf CO2 uptake rate for Ci .
