FIGURE 4.

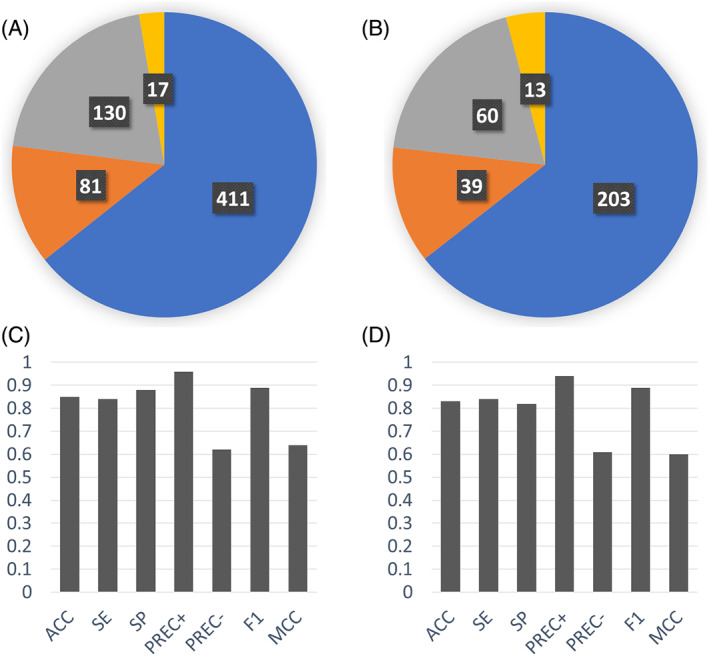
Summary of the “fraction of drug dose excreted unchanged in urine” model performance. (A) Pie chart depicting the training set confusion matrix. (B) Pie chart depicting the test set confusion matrix. (C) Metrics showing the model performance in fitting (prediction of training set molecules). (D) Metrics showing the model performance in validation (prediction of test set molecules). In the confusion matrix pies, colors indicate the different predictions: True positives in blue, false negatives in orange, true negatives in gray and false positives in yellow. In the bar plots, the metrics described are the following: ACC, accuracy; F1, f1‐score; MCC, Matthew's correlation coefficient; PREC+, positive precision; PREC‐, negative precision; SE, sensitivity; SP, specificity [Color figure can be viewed at wileyonlinelibrary.com]
