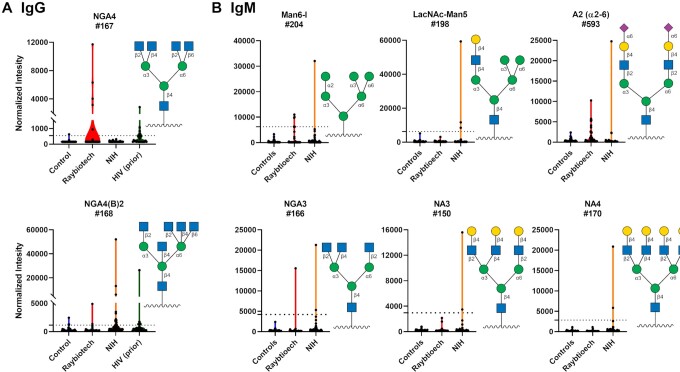
Figure 5.
High IgG and IgM signals to select N-linked glycans in COVID-19 patient serum. Violin plots show high antibody signals to select N-linked glycan array components for serum from COVID-19 patients compared to baseline signals seen in serum from controls, with each point representing data from an individual patient. Where available, graphs also include data from a prior study analyzing antiglycan antibodies of HIV-infected patients (44). To compare high signals to a larger subset of healthy controls, the dashed lines represent 3 SD above the mean of 220 control samples from a previous study (43). (A) IgG. (B) IgM. See symbol legend in Fig. 4. Glycan structures were created using GlycoGlyph (45).

