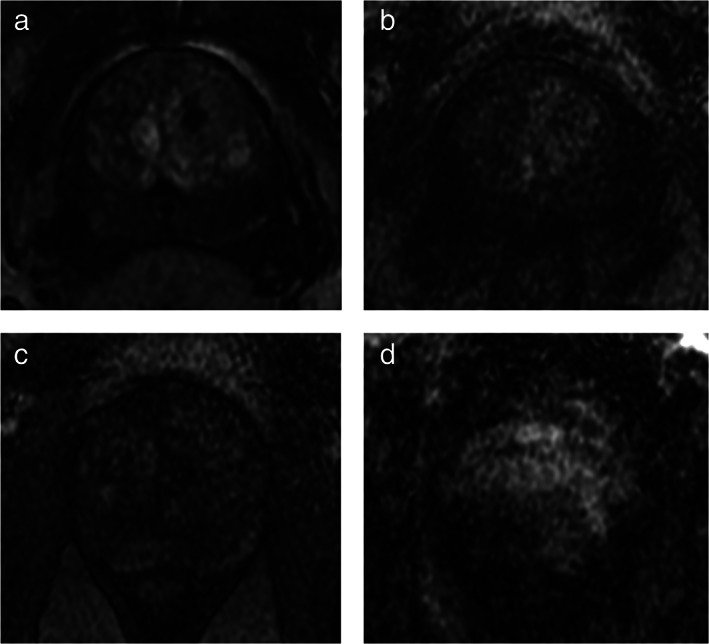
FIGURE 4.

Case examples of high‐ and low‐quality scans on DCE images. It shows examples of high‐ and low‐quality perfusion images: (a) high‐quality DCE image, with good contrast enhancement of the prostate gland; (b) low‐quality image (Q0) with low contrast enhancement of the prostate gland and high noise significantly impairing the sensitivity to detect suspicious foci; (c) low‐quality acquisition (Q0) due to both low contrast enhancement of the prostate gland and to low S/N ratio, the diagnostic sensitivity of this sequence is limited; (d) poor‐quality image (Q0) because of marked motion artifacts—the ability to correctly identify areas of pathologic enhancement is compromised.
