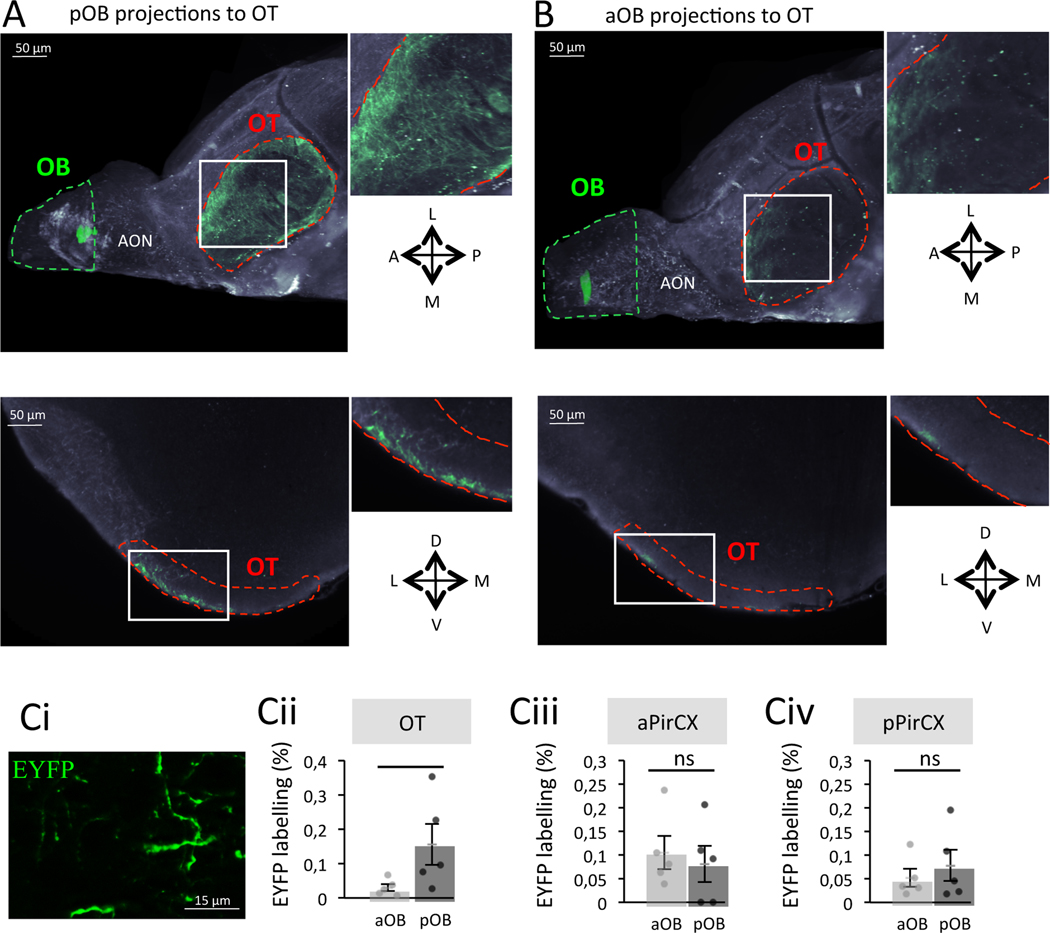
Figure 2. A privileged pathway exists between the pOB and the OT.
A. Representative image of the pOB projecting onto the OT after iDISCO clarification. Top. Ventral projection. Bottom. Coronal optical section. B. Representative image of the aOB projecting onto the OT after iDISCO clarification. Top. Ventral projection. Bottom. Coronal optical section. C. Quantification of the percentage of EYFP labelling (Ci, EYFP labelling = EYFP+area/total area of the field*100) after viral injections in the pOB (n=5) and the aOB (n=5) in the OT (Cii, Bonferroni corrected One-Tailed Mann-Whitney, W=2.000 p=0.048, Rank-Biserial Correlation=−0.840), aPirCX (Ciii, Bonferroni corrected One-Tailed Mann-Whitney, W=14.000 p=1, Rank-Biserial Correlation=0.120) and pPirCX (Civ, Bonferroni corrected One-Tailed Mann-Whitney, W=11.000 p=1, Rank-Biserial Correlation=−0.120). Bars represent means of individual data points ± sem. *:p<0.05. A: Anterior; P: Posterior; L: Lateral; M: Medial; D: Dorsal; V: Ventral.
See also Figure S2.

