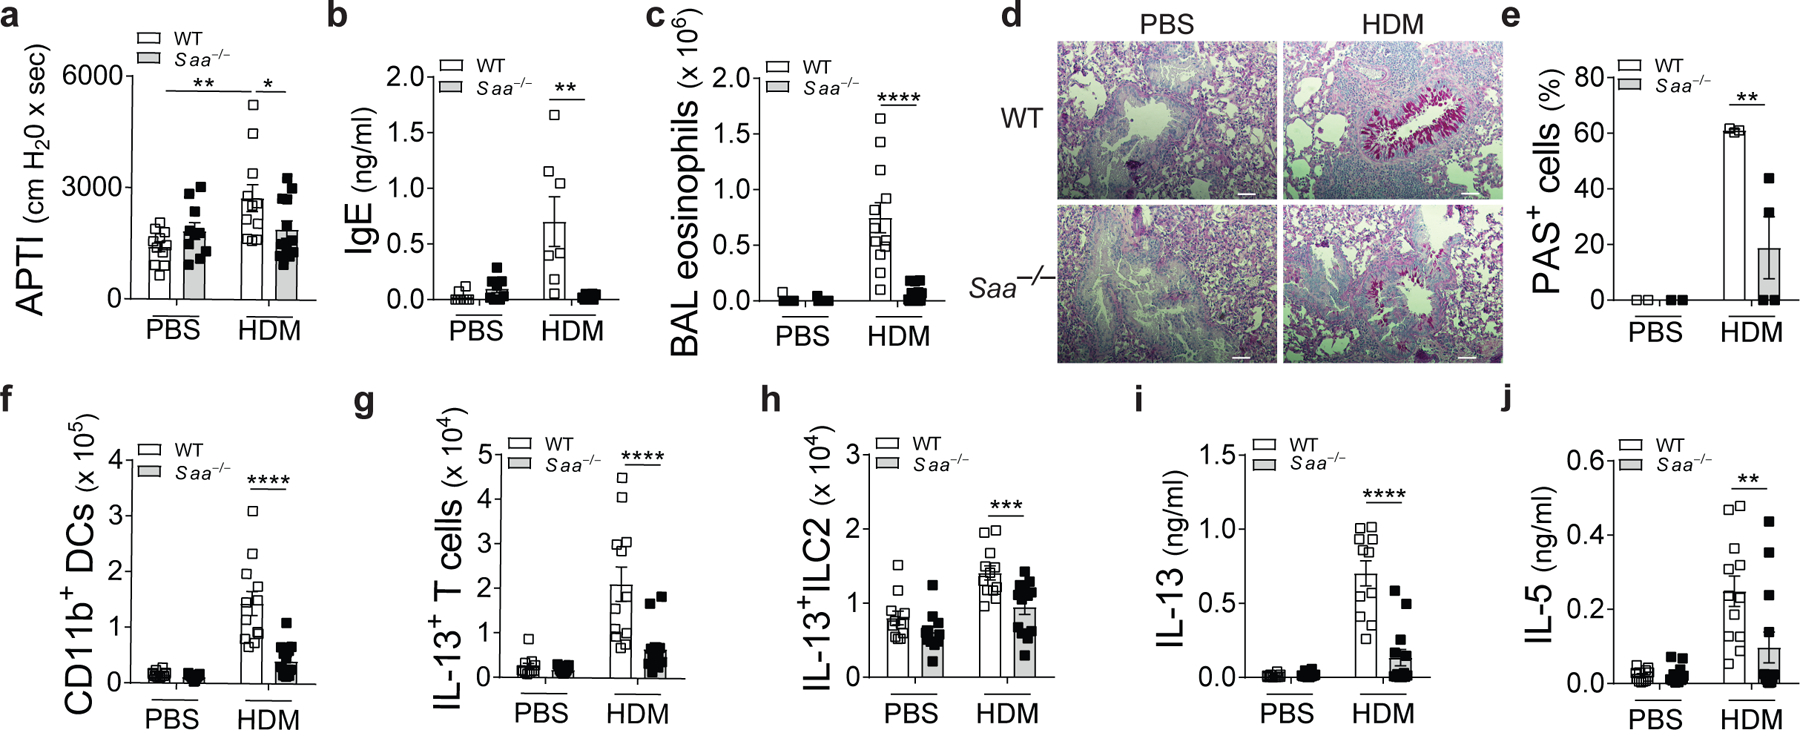
Fig. 1: SAA drives HDM-induced allergic airway inflammation.

Allergic phenotype in WT and Saa–/– C57BL/6 mice sensitized and challenged with HDM was analyzed seventy-two hours after the last challenge. Control mice received PBS at both sensitization and challenge. (a) Airway responses to cholinergic stimulation shown as airway pressure over time (APTI, *P = 0.0378, **P = 0.0019), (b) total serum IgE concentrations (**P = 0.0019), (c) bronchoalveolar lavage (BAL) eosinophilia and (d and e) histological examination of airway inflammation. Sections were stained for mucus production with periodic acid Schiff (PAS; Scale bars 100 μm) and bar graphs represent percentage of mucus positive cells in the airways (*P = 0.0241). Numbers of (f) CD11b+ DCs, (g) IL-13+ CD3+CD4+ and (h) IL-13+ILC2 cells (***P = 0.0003) in the lungs and (i and j) TH2 cytokine production from HDM-restimulated lung cells (**P = 0.0018). Data represent means ± SEM of pooled data from 2 independent experiments containing n=11 WT PBS, n=12 WT HDM, n=11 Saa–/– PBS and n=13 Saa–/– HDM animals per group (a, c, and f-j), n=2 WT PBS, n=3 WT HDM, n=2 Saa–/– PBS and n=4 Saa–/– HDM animals per group (d, e), or are representative of 2 experiments (b) with n=8 WT PBS, n=7 WT HDM, n=8 Saa–/– PBS and n=8 Saa–/– HDM animals per group. P values were calculated with a two-tailed test using one-way analysis of variance (ANOVA) with Dunett’s post hoc (b, c, e-j) or Holm-Sidak’s (a) analysis that compares WT HDM to counterparts. ***P ≤ 0.001; ****P ≤ 0.0001.
