
Figure 3.
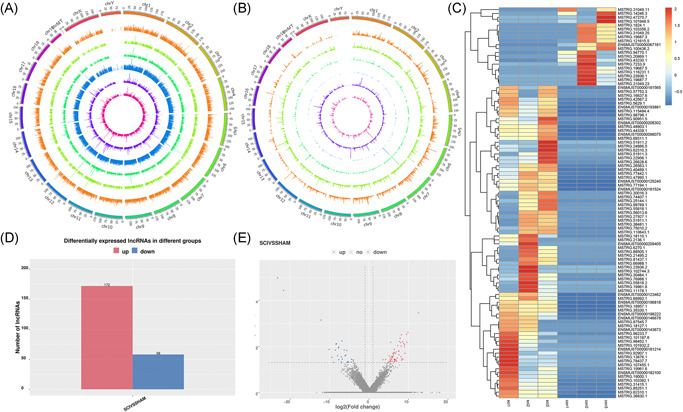
Genome Mapping and Genome‐wide identification. Distribution of lncRNAs in the genome of different samples. There are six layers from the outside to the inside, and each layer shows the chromosome distribution and expression of lncRNAs of one sample. The outer three layers represent the SCI group, and the inner three layers represent the Sham group. The height of the column in each layer represents the expression level, and the higher the expression level, the higher the column height (A). RNA distribution of six types of lncRNAs along each chromosome. Known lncRNAs (class code = , depicted in orange), intronic lncRNAs (class code i, depicted in light green), lncRNAs sharing a reference with at least 1 splice junction (class code j, depicted in the dark green), lncRNA of generic exonic overlap with a reference transcript (class code o, depicted in blue), intergenic lncRNA (class code u, depicted in violet), and antisense lncRNA (class code x, depicted in pink) are presented in physical bins of 500 kb for each chromosome (B). Heatmap of top differentially expressed lncRNAs (C). Barplot of DE lncRNAs (D). Volcano plots showing variance in differentially expressed lncRNA (E). Red and blue points indicate up‐ and downregulated lncRNAs, respectively. DE, differentially expressed; lncRNA, long noncoding RNA