
Figure 3.
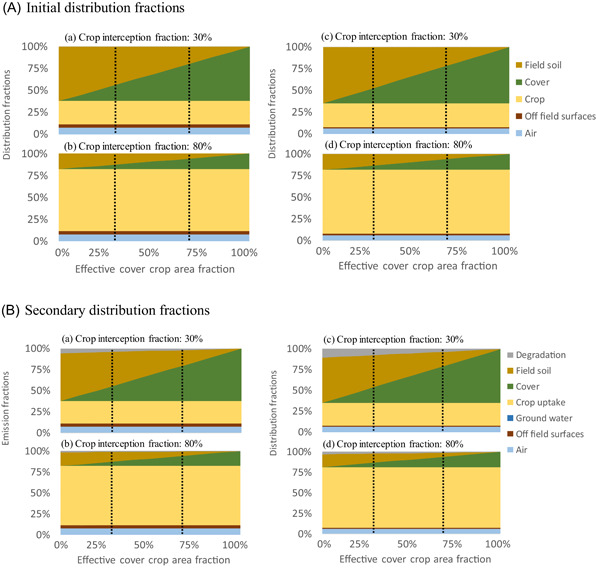
Initial (A) and secondary (B) emission distribution fractions for two crop growth stages, and , respectively, corresponding to the installation (a, c) and flowering stage (b, d), for grapevine (a, b) and tomato (c, d) for a range of effective area fractions of crop‐free field that is covered by cover crop (. Vertical lines represent the cover crop setup of the case study with and