FIGURE 2.

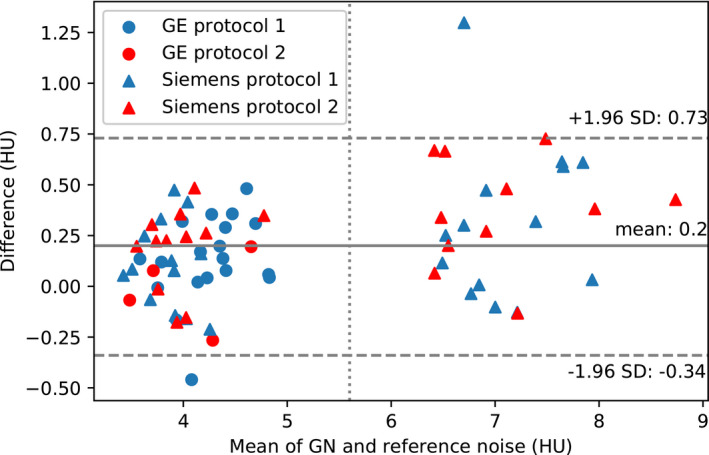
Differences between GN and reference noise values shown in a Bland–Altman plot. Data points to the right of the vertical dashed line are from simulated low‐dose examinations from Siemens Protocols 1 and 2

Differences between GN and reference noise values shown in a Bland–Altman plot. Data points to the right of the vertical dashed line are from simulated low‐dose examinations from Siemens Protocols 1 and 2