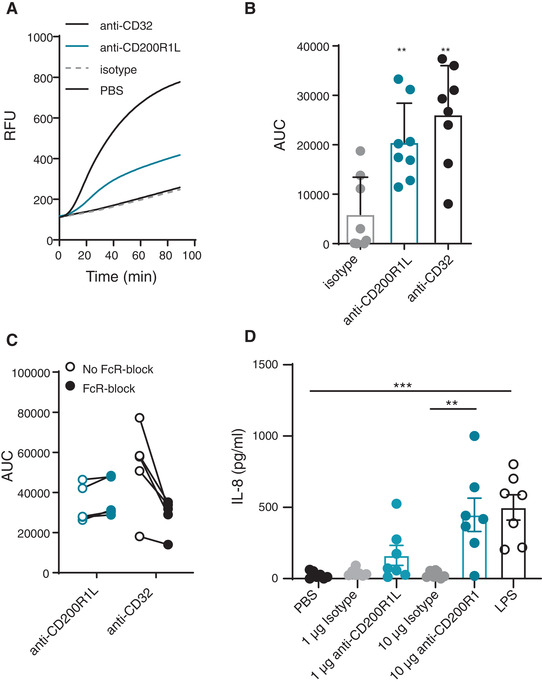
FIGURE 2.

CD200R1L stimulation induces ROS and cytokine production by neutrophils. (A–C) ROS production by neutrophils after 90 minutes stimulation with isotype, anti‐CD200R1L, or anti‐CD32. (A) Representative ROS production in a healthy donor. RFU: relative fluorescent units. B) Quantification ROS production as the area under the curve (AUC) in multiple donors stimulated as in 2A. Wilcoxon signed‐rank test was performed to compare ROS production in isotype versus anti‐CD200R1L or anti‐CD32. **p < 0.01, 8 donors from 4 experiments. Bars represent means + SD. (C) Areas under the curve (AUC) of ROS production with and without FcR block with anti‐CD32 or anti‐CD200R1L stimulation (p = 0.05, n = 5 from 3 independent experiments). (D) IL‐8 production by neutrophils after PBS, isotype, anti‐CD200R1L and LPS stimulation for 24 h. one‐way ANOVA with Tukey multicomparison test. **p < 0.01, ***p < 0.001, n = 7 from 4 experiments
