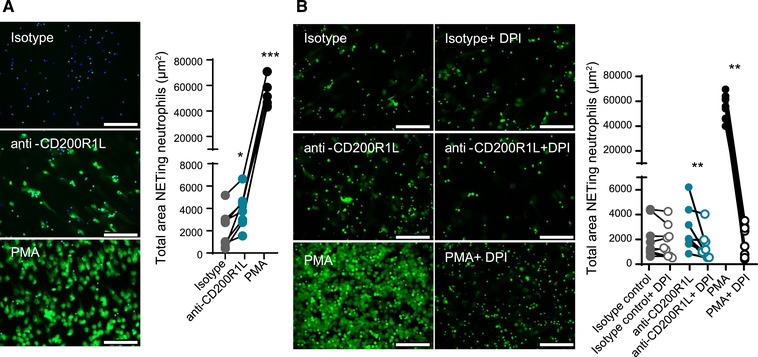
FIGURE 4.

CD200R1L stimulation induces NET release. (A) NETosis induced after 4 h stimulation with isotype control, anti‐CD200R1L or PMA analyzed by SYTOX‐green staining. Representative images for each stimulation are shown. Data are presented as total area NETing neutrophils (μm2). Mann‐Whitney test comparing anti‐CD200R1L or PMA stimulation with isotype control. (B) Purified healthy donor neutrophils were stimulated with IgG1 isotype control, anti‐CD200R1L, PMA with or without DPI for 4 h. Representative images for each stimulation are shown and data was analyzed as in Fig. 4A). Wilcoxon test. (A, B) Scale 100μ. Data from 8 donors in 4 independent experiments. *p < 0.05, **p < 0.01, ***p < 0.001
