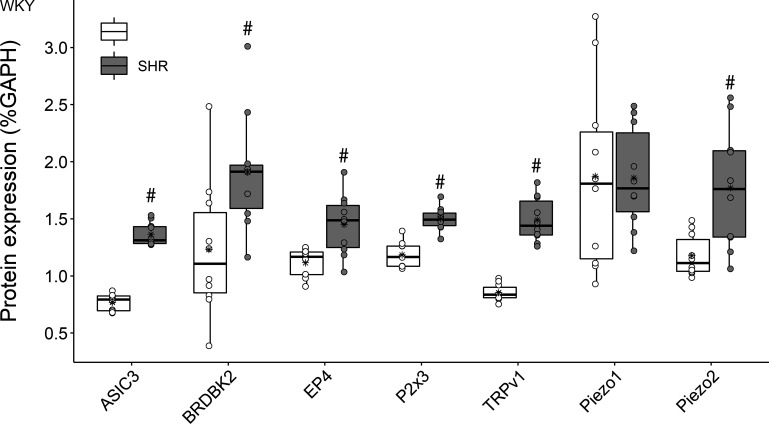
Figure 2.
Protein expression of molecular dorsal root ganglion (DRG) receptors in normotensive (Wistar-Kyoto, WKY, n = 10) and hypertensive (spontaneously hypertensive rat, SHR, n = 10) male rats. In the box plots, the boundary of the box closest to zero indicates the 1st quartile, a black line within the box marks the median, and the boundary of the box farthest from zero indicates the 3rd quartile. Asterisk represents group mean. Whiskers represent the lowest and highest values which are not outliers. Points above and below the whiskers indicate outliers identified as 1.5 times interquartile range above the 3rd quartile or below the 1st quartile. A priori, unpaired Student’s t tests were used to test group differences. Data are means ± SD. #P < 0.05 vs. WKY.

