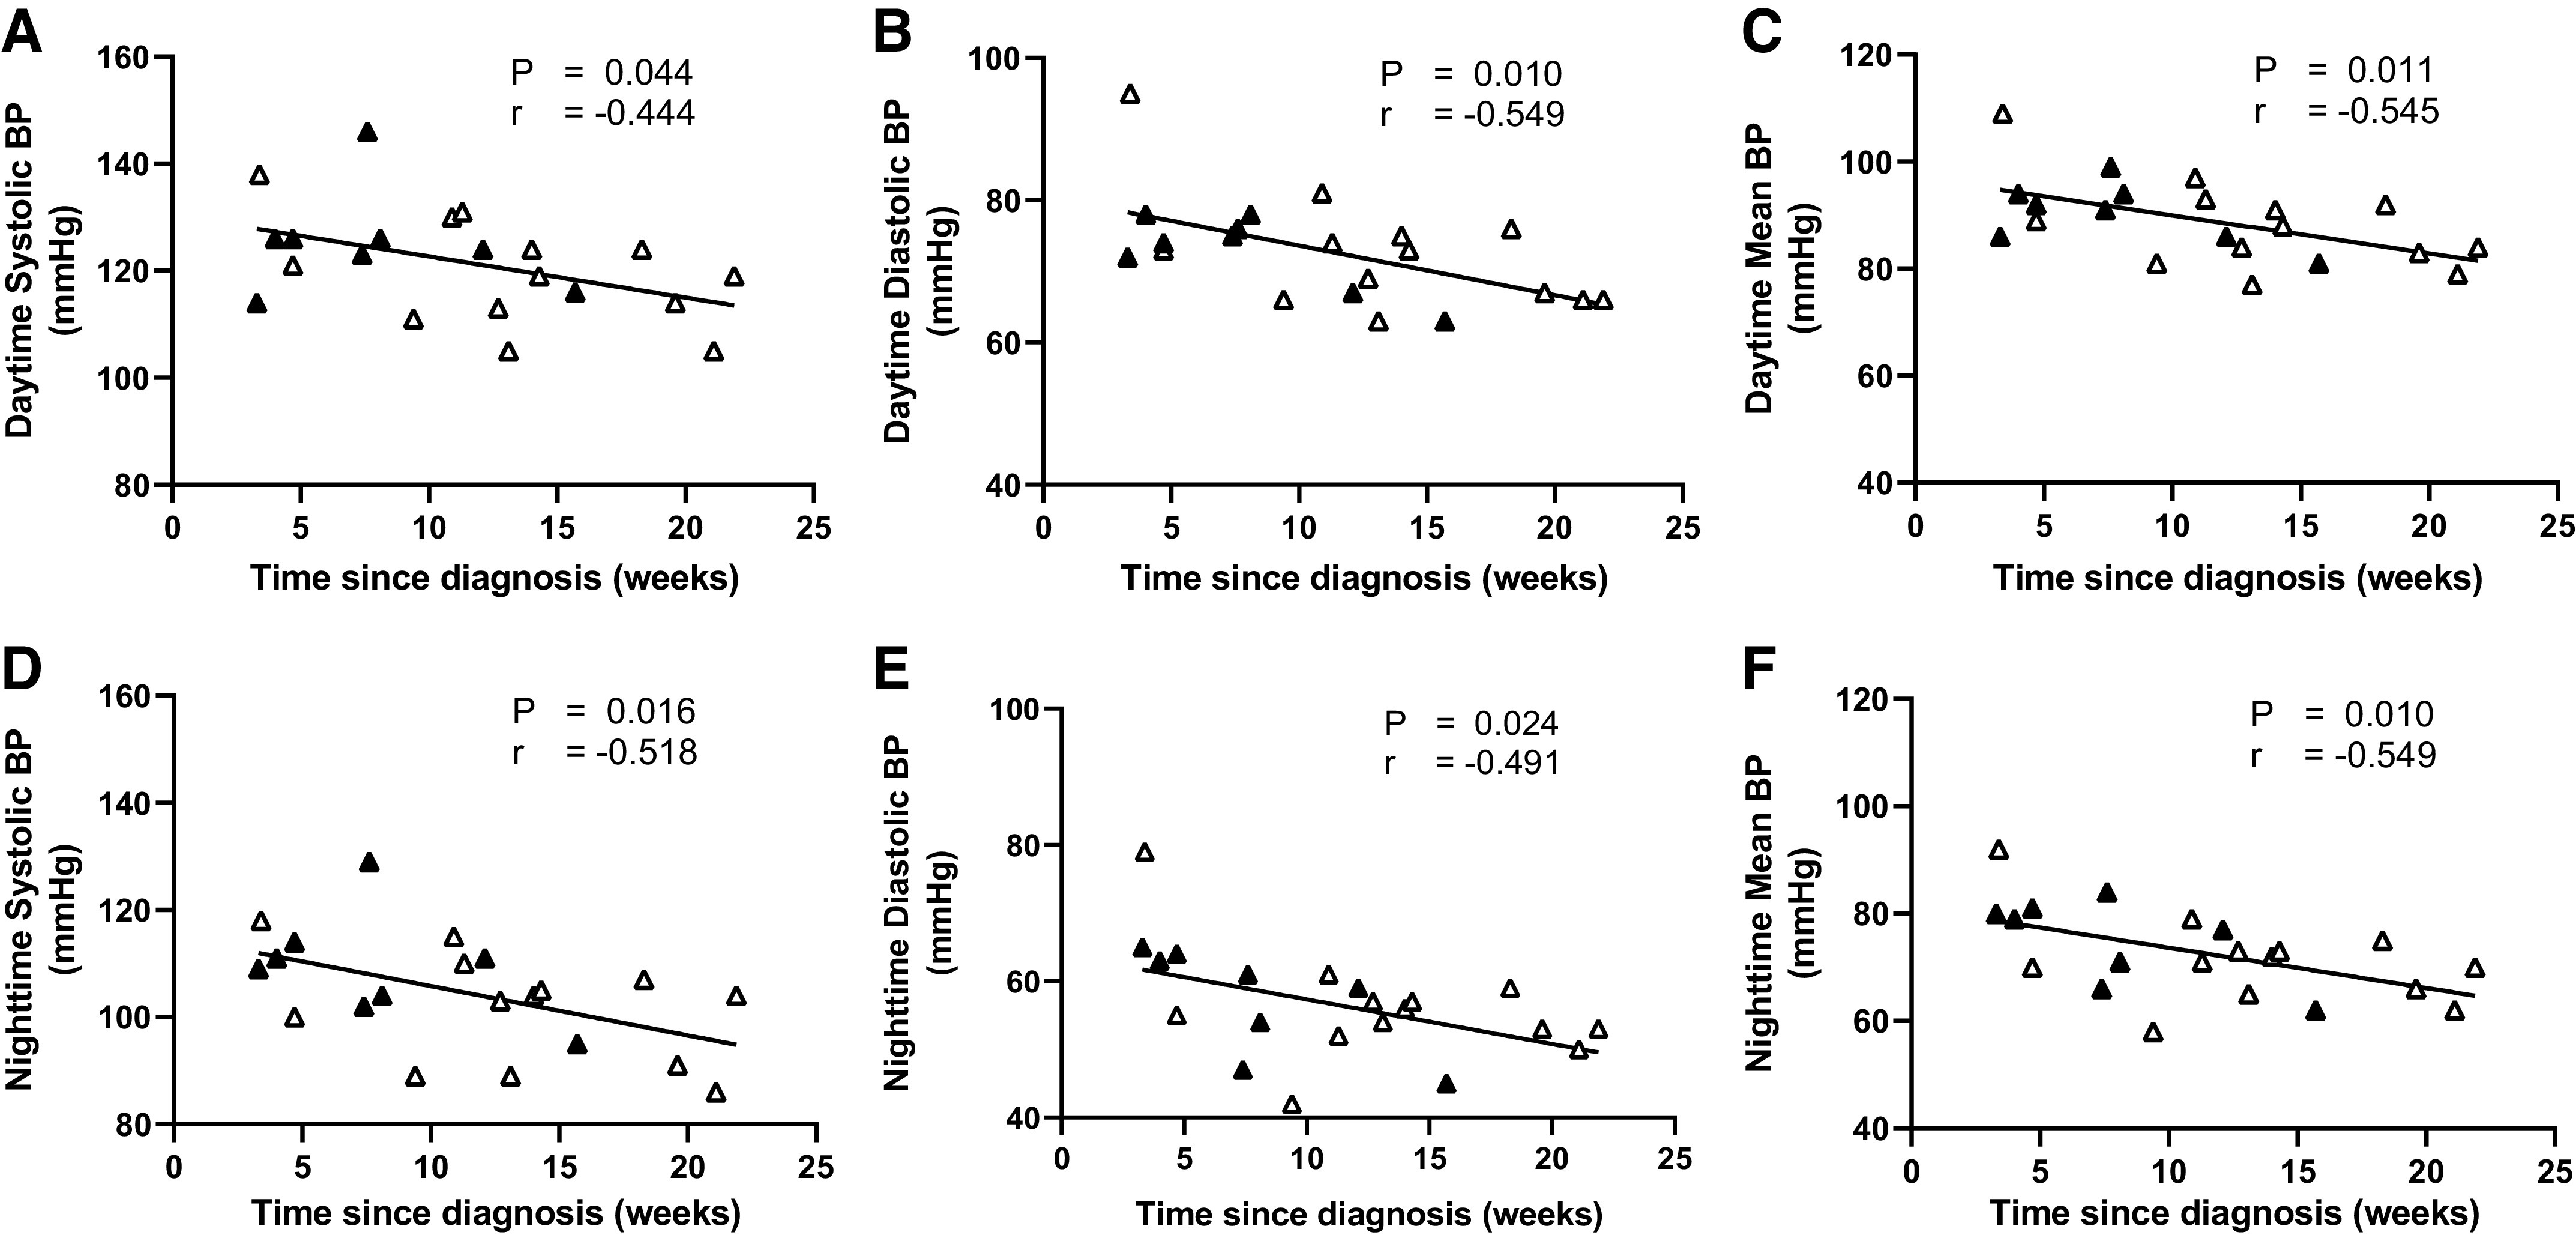
Figure 2.

Relationship between time since diagnosis and ambulatory daytime (A, B, and C) and nighttime (D, E, and F) systolic blood pressure (BP), diastolic BP, and mean BP in the COVID group (n = 21; 8 males). Black symbols represent males and white symbols represent females. r = correlation coefficient.
