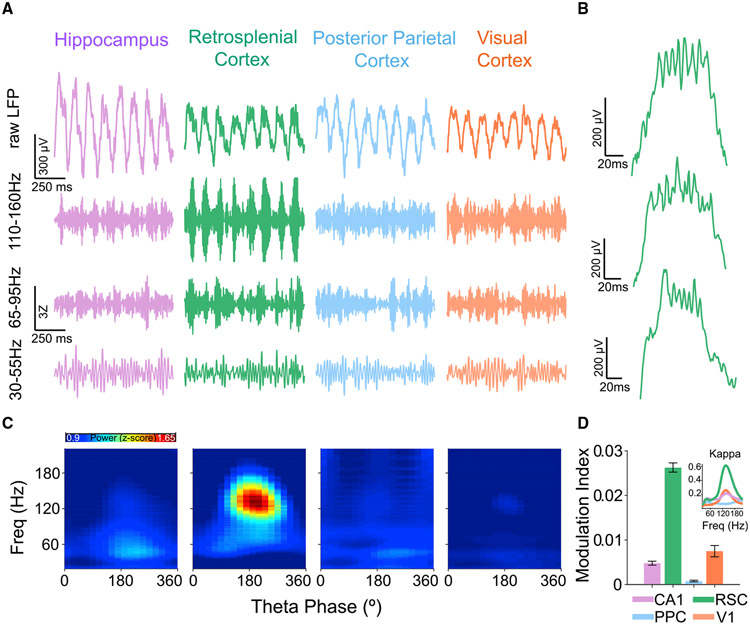
Figure 2. Retrosplenial splines are precisely coupled to the peak of theta.
(A) Examples of simultaneously recorded raw and filtered LFP traces during REM sleep from CA1 (purple), RSC (green), PPC (blue), and V1 (orange) showing theta oscillations in all four brain regions with strong spline oscillations (110–160 Hz) at the peak of theta exclusively in RSC. Power in high-gamma (65–95 Hz) and low-gamma (30–55 Hz) bands is much weaker than spline power in RSC and often phase-shifted compared with splines.
(B) Single retrosplenial theta cycle examples during REM sleep from three rats. Splines are consistently locked to the peak of RSC theta in all animals.
(C) Population theta phase-amplitude coupling across the four brain regions during REM sleep. A phase of 180° represents the peak of theta. Splines are precisely coupled to the peak of RSC theta.
(D) Strength of theta phase-amplitude coupling quantified for each LFP using the modulation index (MI) metric. Splines are more precisely coupled to theta in the RSC than in any other brain region (rank-sum test, p < 0.001). Inset shows kappa (measure of strength of phase-locking for circular variables) values for theta phase-amplitude coupling of each frequency. Kappa for splines was significantly higher (rank-sum test, p < 0.0001) in RSC compared with CA1, PPC, and V1.

