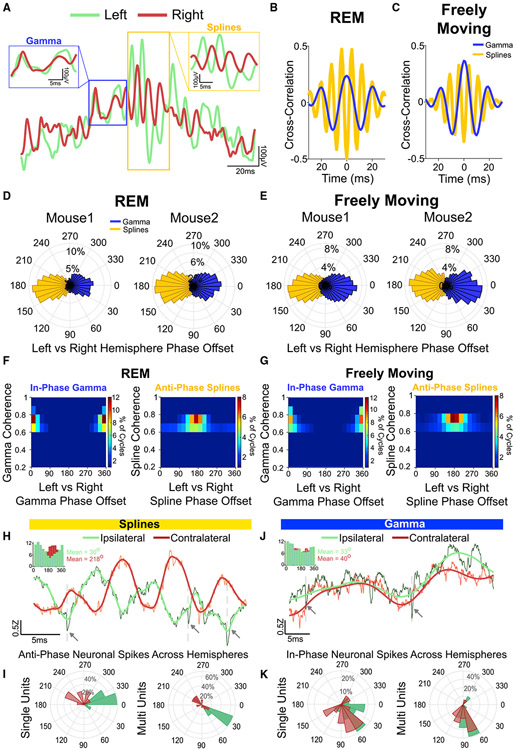
Figure 6. Splines are anti-phase across hemispheres while gamma oscillations are in-phase during REM sleep and awake active states.
(A) Example raw LFP trace during REM showing a theta cycle from the left hemisphere (green) overlaid with a simultaneously recorded LFP from the right hemisphere (red). Gamma oscillations were in phase, but splines in the contralateral hemisphere were 180° out of phase (insets show zoomed views).
(B) Cross-correlation from a REM session shows that splines (gold) were anti-phase across hemispheres while gamma oscillations (blue) were in-phase.
(C) Same as (B) during a freely moving session.
(D) Distribution of coherence phase (degrees) between the left and right hemisphere during REM sessions from two mice. A clear 180-degree phase offset was seen for splines.
(E) Same as (D) during freely moving sessions.
(F) Distribution of spline and gamma coherence magnitude and phase (degrees) across three mice (nine sessions) shows that splines were consistently anti-phase (mean phase = 163°, kappa = 0.7) across hemispheres while gamma oscillations were in-phase (mean phase = 2°, kappa = 2.2) during REM.
(G) Same as (F) during freely moving sessions (three mice, nine sessions) shows that splines were consistently anti-phase across hemispheres (mean phase = 180°, kappa = 0.9) while gamma oscillations were in-phase (mean phase = 2.2°, kappa = 1.6).
(H) Example raw (black) and 3–500 Hz filtered (green) LFP showing spikes (dotted lines, arrows) at the trough of local splines. A simultaneously recorded raw (orange) and 3–500 Hz filtered (red) LFP from the contralateral hemisphere shows the same spikes locked to the peak of contralateral splines. Inset shows phase-locking from a single unit to local (green) and contralateral (red) splines showing significant phase-locking to the trough of ipsilateral (local) splines (mean phase = 30°, ln(Rayleigh’s Z) = 3.9, p < 0.001) and the peak of contralateral splines (mean phase = 218°, ln(Rayleigh’s Z) = 2.4, p < 0.001).
(I) Mean phase distribution (degrees) of the significantly phase-locked cells to local and contralateral splines. There was a significant difference between the preferred phase for ipsilateral compared with contralateral splines (Watson Williams test, p < 0.0001).
(J) Example raw (black) and 3–80 Hz filtered (green) LFP showing spikes (dotted lines, arrows) at the trough of gamma. A simultaneously recorded raw (orange) and 3–80 Hz filtered (red) LFP from a contralateral channel shows the same spikes locked to the trough of gamma. Inset shows phase-locking from a single unit to local (green) and contralateral (red) gamma showing significant phase-locking to the trough of both ipsilateral (local) gamma (mean phase = 33°, ln(Rayleigh’s Z) = 3.42, p < 0.001) and contralateral gamma (mean phase = 40°, ln(Rayleigh’s Z) = 2.2, p < 0.001).
(K) Mean gamma phase distribution (degrees) of the significantly phase-locked cells. There was no significant difference between the preferred phase distributions for ipsilateral versus contralateral gamma rhythms (Watson Williams test, p = 0.16).

