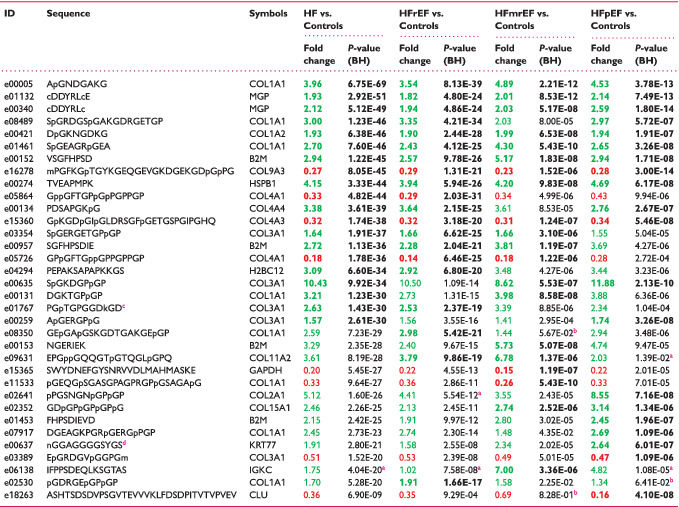
Table 2.
List of the 20 peptides providing the greatest discrimination between patients with heart failure (HF, n = 773) and matched controls (n = 773) as well as between matched controls and patients with HF with reduced (HFrEF, n = 442), mid‐range (HFmrEF, n = 144) and preserved ejection fraction (HFpEF, n = 187)

|
BH, Benjamini–Hochberg.
Peptides are ordered by increasing P‐value in HF vs. controls.
Bold indicates top 20 peptides in individual comparisons.
Peptides higher in disease are labelled in green, lower in red.
Peptides that did not pass the frequency threshold of 30%.
Peptides that did not pass the P‐value (BH adjusted) threshold of 0.05.
Posttranslational modification: formylation (K).
Posttranslational modification: deamination (N).
