
FIGURE 3.
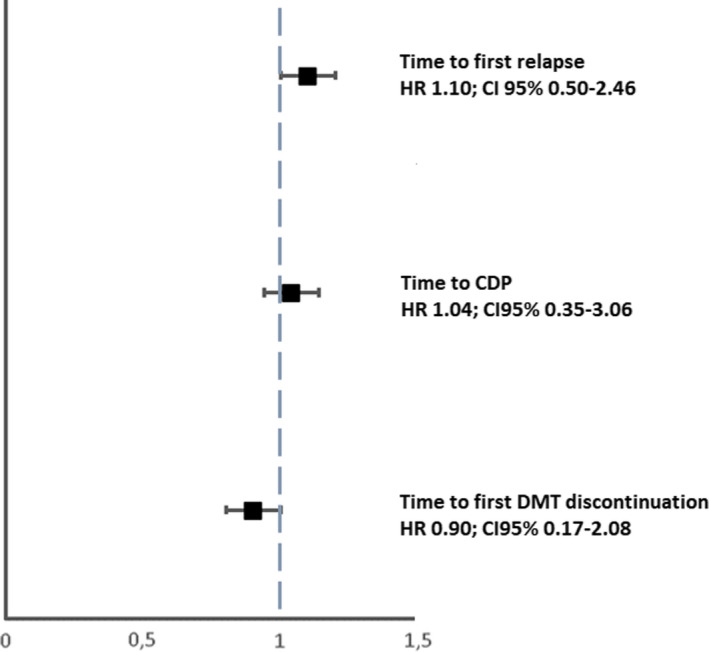
Analysis of treatment effects in time to first relapse, time to CDP, and time to DMT discontinuation. The treatment effects were explored by a propensity‐score adjustment in quintiles for age, duration of disease from onset, Expanded Disability Status Scale at baseline, relapses in the previous year, sex, and clinical onset. CDP, confirmed disability progression; CI, confidence interval; DMT, disease‐modifying therapies; HR, hazard ratio