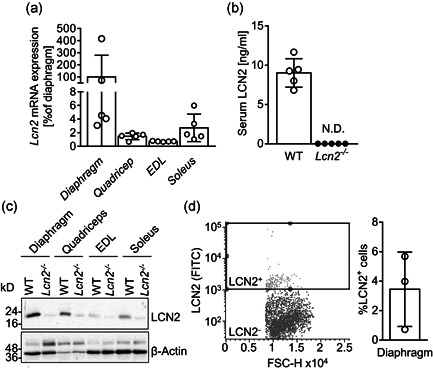
Figure 2.

LCN2 expression in mouse muscle tissues. (a) Lcn2 mRNA expression analysed in muscle sections from diaphragm, quadriceps, EDL and soleus of WT male mice. Results are the % to the average of the diaphragm ΔC ts (N = 5 mice per group). (b) ELISA showing circulating levels of LCN2 in WT and Lcn2 −/− mice. (c) Western blot representative of three mice per group, showing muscle expression of LCN2 and β‐Actin as a loading control. (d) Cytofluorimetric analysis of mononuclear cells extracted from the diaphragm of 6‐month‐old WT mice and stained for LCN2. Left panel: representative dot plot with gating box; right panel: quantification of percent LCN2 positive cells. EDL, Extensor Digitorum Longus; ELISA, enzyme‐linked immunosorbent assay; mRNA, messenger RNA; WT, wild‐type
