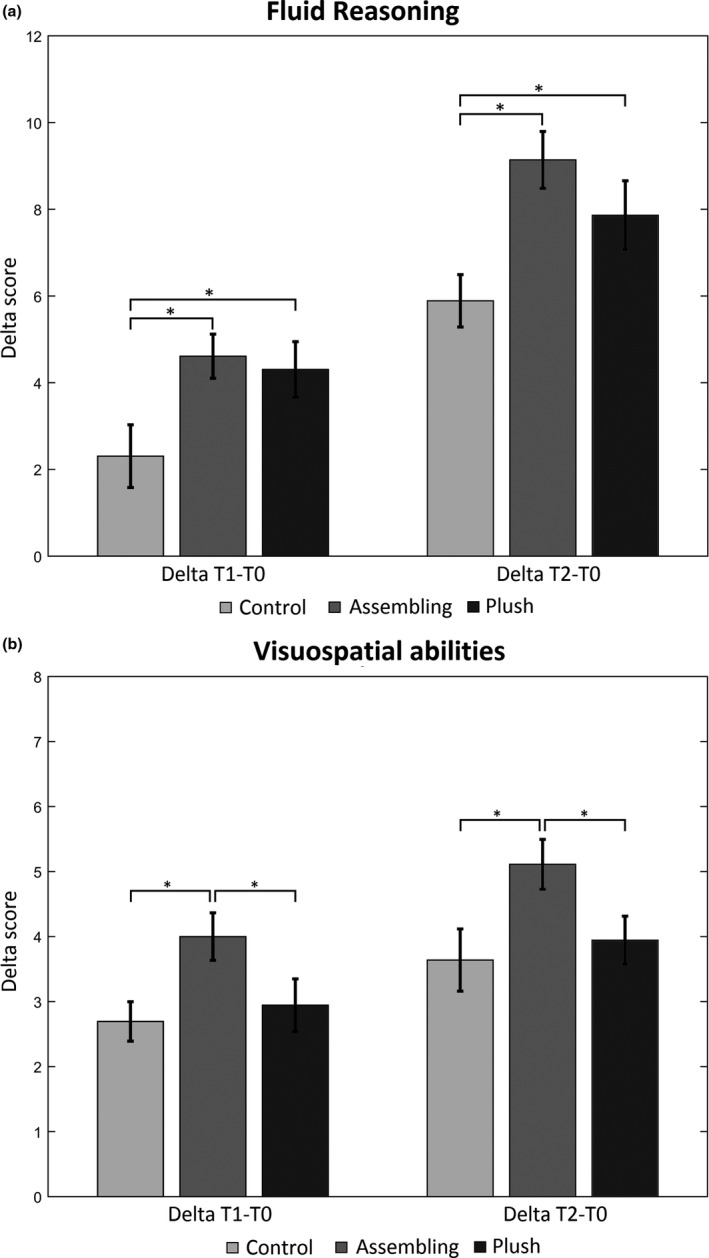
FIGURE 2.

Scores for control, assembling, and plush groups at Delta 1 (T1–T0) and Delta 2 (T2–T0) for fluid reasoning (a) and visuospatial abilities (b). Bars indicate the standard error, while asterisks indicate scores significantly different between groups at post hoc analysis (p < .05)
