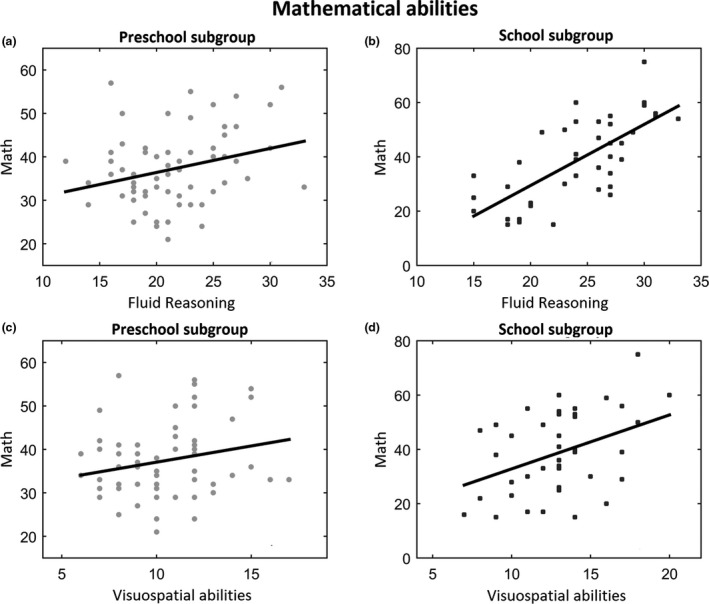
FIGURE 4.

Left side: Results of the correlation analyses in preschool subgroup between fluid reasoning (a) and Math (c) scores (r = .28, p = .02), and between visuospatial abilities and Math scores (r = .23, p = .07). Right side: Correlation analyses in school subgroup between both fluid reasoning (b) (r = .71, p < .001) and visuospatial abilities (d) (r = .40, p = .01) against mathematical abilities. Each dot indicates a single participant. The solid black line indicates the linear fitting
