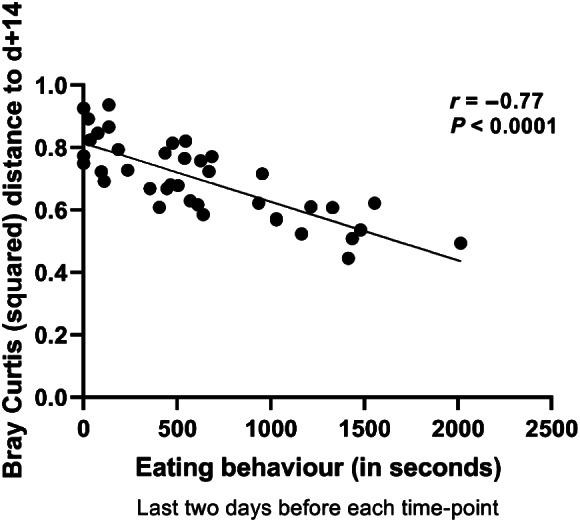
Fig. 4.

Spearman correlation between eating scores of individual animals (n = 10 EF piglets) and squared Bray–Curtis distance to their day +14 ‘matured’ time point. The last 2 days eating behaviour before each corresponding time point (three time‐points: day 15, day 21 and day 28) was employed (r = −0.77, P < 0.0001).
